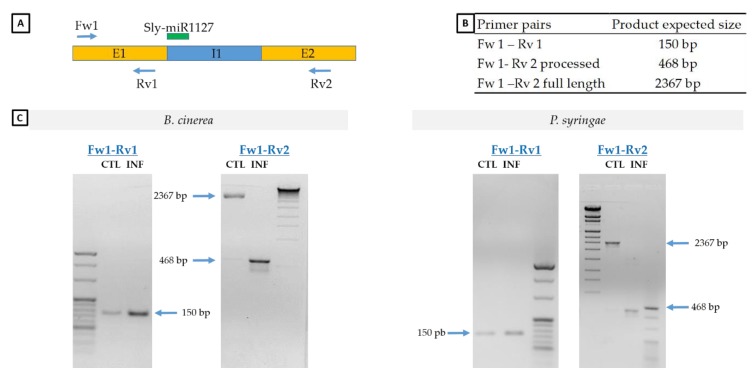
Figure 5.
RT-PCR amplification of SlyWRKY75 mRNA. (A) Schematic diagram of SlyWRKY75 gene structure. Green bar indicates sly-miR1127-binding site in SlyWRKY75 intron 1. Arrows indicate the annealing positions of primer pair Fw1 and Rv1 in exon 1 and Rv2 in exon 2. (B) Table showing the different amplicons sizes. (C) RT-PCR analysis of SlyWRKY75 mRNA in control tomato plants and tomato plants 24 h after infection by P. syringae or B. cinerea using primer pair Fw1-Rv1 or Fw1-Rv2. For each sample, three biological replicates were pooled and analysed.

