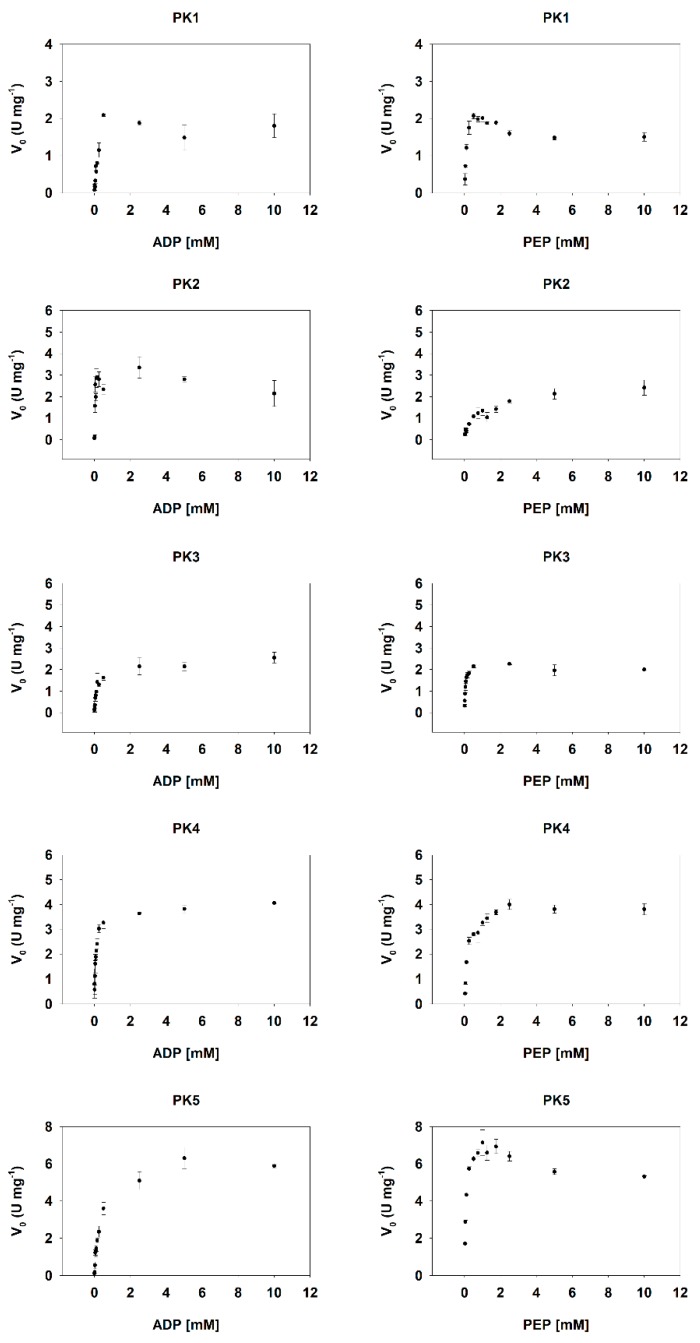
Figure A5.
Biochemical characterization of cytosolic pyruvate kinase isoenzymes. Km values of cPK1, cPK2, cPK3, cPK4 and cPK5 for ADP (left panel) and PEP (right panel) were determined by nonlinear regression based on the Michaelis–Menten equation. Linear dilutions of ADP (0.005, 0.01, 0.025, 0.05, 0.075, 0.1, 0.15, 0.25, 0.5, 2.5, 5.0 and 10.0 mM) and PEP (0.025, 0.05, 0.1, 0.25, 0.5 0, 0.75, 1.0, 1.25, 1.75, 2.5, 5.0 and 10.0 mM) were used. Data are mean ± SD of four replicates.

