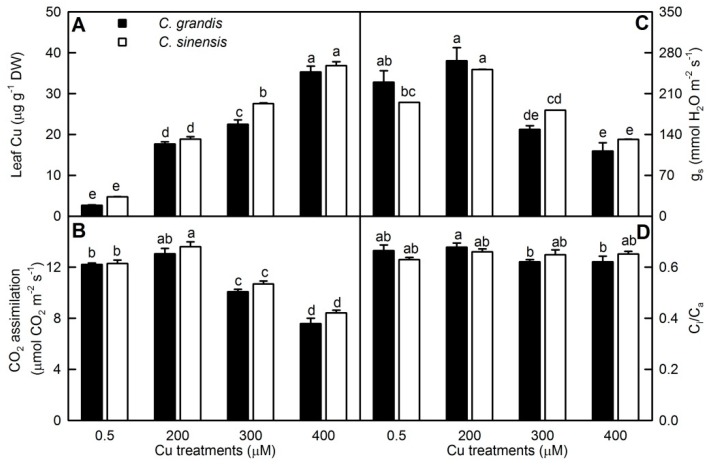
Figure 1.
Cu-effects on Cu concentration (A), CO2 assimilation (B), stomatal conductance (gs, C) and ratio of intercellular to ambient CO2 concentration (Ci/Ca, D) in Citrus grandis and Citrus sinensis leaves. Bars represent means ± SE (n = 8 except for 4 for leaf Cu). Different letters above the bars indicate significant differences at p < 0.05.

