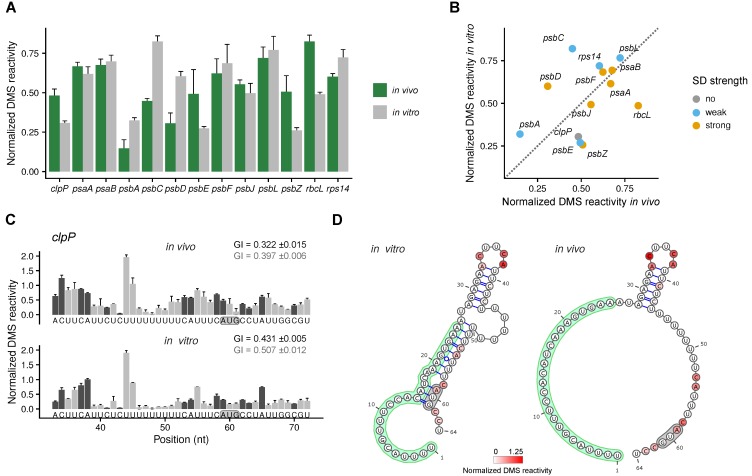
Figure 2.
Analysis of mRNA secondary structure of start codons. (A) Average normalized DMS reactivities at the start codon in in vivo samples (green) and in vitro-folded RNA (grey) (only adenosines were analyzed). Higher normalized DMS reactivity values indicate start codons that are more accessible. (B) Comparison of the average normalized DMS reactivity at the start codon between in vitro-folded RNA and in vivo. The color code marks genes with strong Shine–Dalgarno (SD) sequences (hybridization to the anti-SD of the 16S rRNA < −6 kcal mol−1, green), weak SD (>−6–< 0 kcal mol−1, blue), and no SD (>0 kcal mol−1, grey). (C) Normalized DMS reactivities at the translation initiation region of clpP. The dark grey bars represent the more reliable probing of adenosines and cytidines (compare to Figure 1B,C), light grey is the less reliable probing of guanosines and uridines. The start codon is marked with a grey background. The sequence covered by the primer used to amplify the cDNA (1–32 of the clpP mRNA) does not contain any information about the mRNA secondary structure and is therefore not shown. As measure of the secondary structure of the whole translation initiation region, the Gini index (GI) is given for adenosines/cytidines (black) and all four nucleotides (grey). A value close to 0 indicates a low amount of structure, a value close to 1 a high amount of structure. (D) Models of the secondary structure of the translation initiation region of clpP in vivo and in vitro (see Supplemental Figure S3 for a prediction of the structure of the clpP transcript). The color code indicates the DMS reactivities at adenosines and cytidines. The green part is the footprint of the putative RNA binding protein [33]. The start codon is marked with a grey background.

