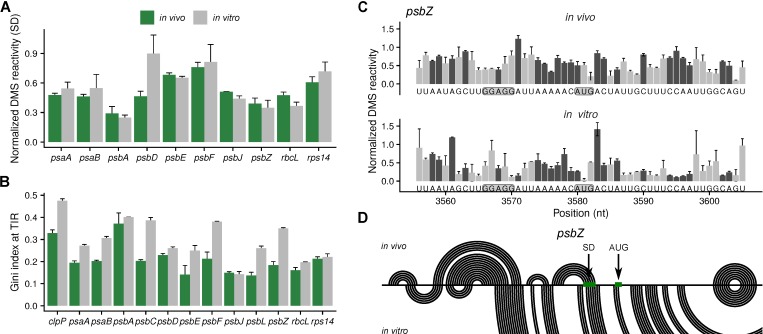
Figure 3.
Analysis of mRNA secondary structure of Shine-–Dalgarno sequences (SD) and translation initiation regions (TIR). (A) Average normalized DMS reactivities at the Shine–Dalgarno sequences in in vivo samples (green) and in vitro-folded RNA (grey) (adenosines and cytidines were analyzed). Only genes with SD are included (Supplemental Table S1). Higher normalized DMS reactivity values indicate nucleotides that are more accessible. (B) Gini index of the translation initiation regions (−25 to +5 relative to the first nucleotide of the start codon). A value close to 0 indicates a low amount of structure, a value close to 1 a high amount of structure. (C) The normalized DMS reactivities at the translation initiation region of psbZ. The dark grey bars represent the more reliable probing of adenosines and cytidines (compare to Figure 1B,C), light grey is the less reliable probing of guanosines and uridines. The Shine–Dalgarno sequence (GGAGG) and the start codon (AUG) are marked with a grey background. (D) Predicted mRNA secondary structures of the psbZ translation initiation region in vivo and in vitro presented as arc-plots using DMS reactivities (at adenosines and cytidines) as constrains. The positions of the Shine–Dalgarno sequence (SD) and the start codon (AUG) are marked (compare also Figure 2A for the DMS reactivity at the start codon).

