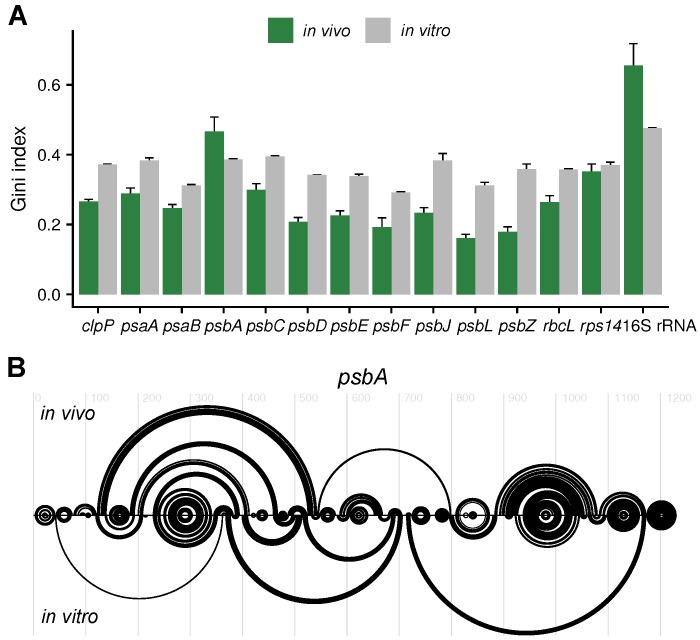
Figure 4.
Analysis of mRNA secondary structure of coding regions. (A) Gini index of the coding regions for in vivo samples (green) and in vitro-folded RNA (grey). A value close to 0 indicates a low amount of structure, a value close to 1 a high amount of structure. Included is the 16S rRNA that was used as control with known structure (see Figure 1B–D). See also the normalized DMS reactivities of the complete RNAs (Supplemental Figure S4). (B) Predicted mRNA secondary structure of psbA in vivo and in vitro presented as arc-plots using DMS reactivities (at adenosines and cytidines) as constrains. The full-length transcript was used for the predictions.

