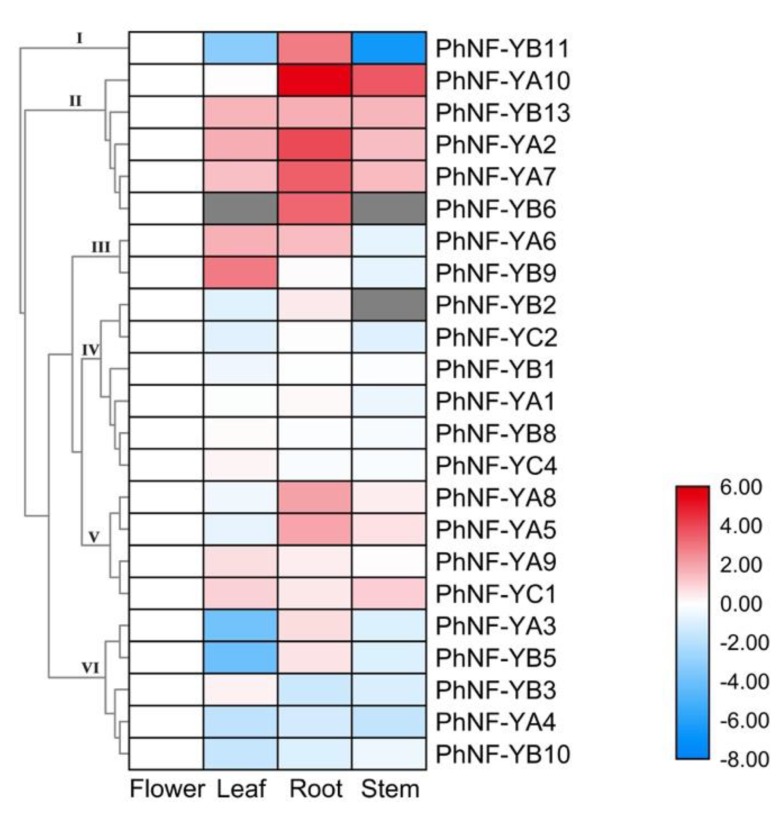
Figure 6.
Expression profiles of PhNF-Ys in different tissues. A cluster dendrogram is shown on the left. NF-Ys are divided into six major groups based on their expression patterns. Grey boxes indicate that transcription was not detected at that timepoint. The bar on the lower right corner represents log2-based expression values transformed from fragments per kilobase of exon per million reads mapped (FPKM) values. Blue and red indicate decreased and increased transcript abundance, respectively, compared to controls (flower).

