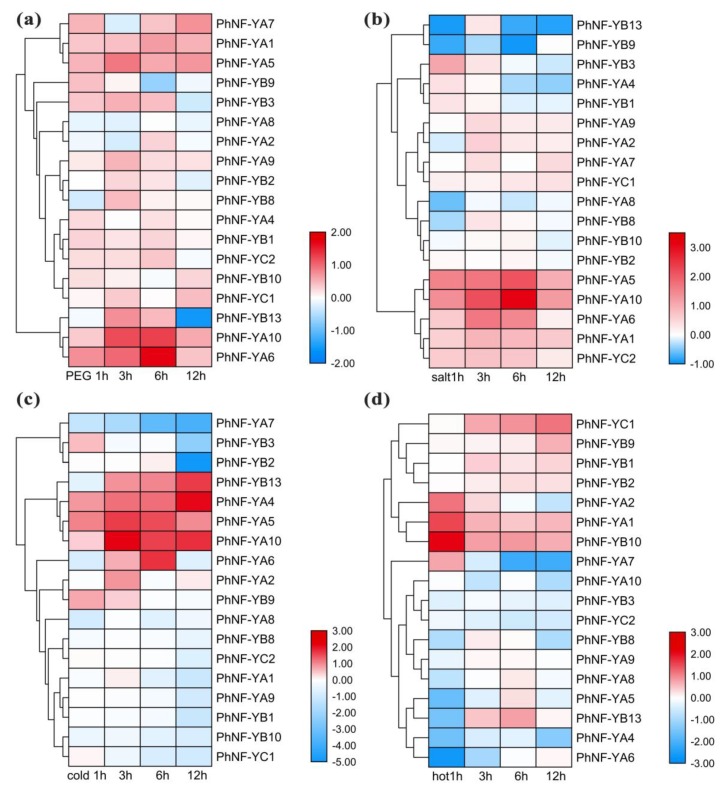
Figure 7.
Expression profiles of PhNF-Ys in response to abiotic stress treatments. (a) Expression profiles of PhNF-Ys under drought treatment (20% PEG). (b) Expression profiles of PhNF-Ys under salt treatment (500 mM). (c) Expression profiles of PhNF-Ys under cold treatment (4 °C). (d) Expression profiles of PhNF-Ys under hot treatment (40 °C). The treatments and timepoint are marked at the bottom of each column. The bars on the right bottom indicate fold-change values (log2 values) with red representing increased transcript abundance and blue indicating decreased transcript abundance.

