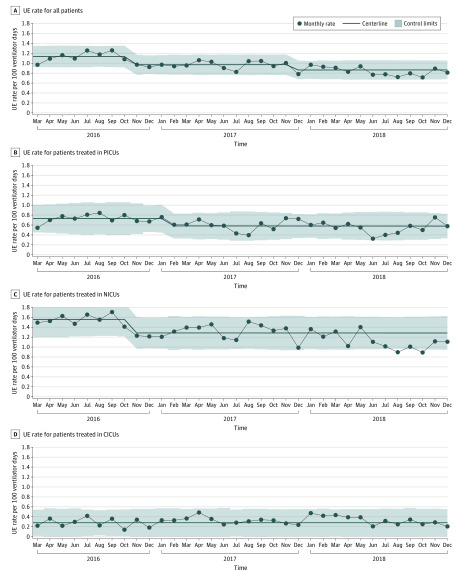
Figure 1. Unplanned Extubation (UE) Rates by Setting.
Statistical process control charts of UE rates. A, There was an aggregate 24.1% reduction in UE events among all patients, from a baseline rate of 1.135 UEs per 100 ventilator days to 0.862 UEs per 100 ventilator days. B, There was an absolute reduction in UE events of 20.6% among patients treated in the pediatric intensive care unit (PICU), from a baseline rate of 0.729 UEs per 100 ventilator days to 0.579 UEs per 100 ventilator days. C, There was an absolute reduction in UE events of 17.6% among patients treated in the neonatal ICU (NICU), from a baseline rate of 1.555 UEs per 100 ventilator days to 1.282 UEs per 100 ventilator days. D, The UE rate of 0.281 UEs per 100 ventilator days did not change over the study period among patients treated in the cardiac ICU (CICU). Centerline shift was determined by the Shewhart rule of 8 or more points below the centerline. The centerline shift began in November 2016.

