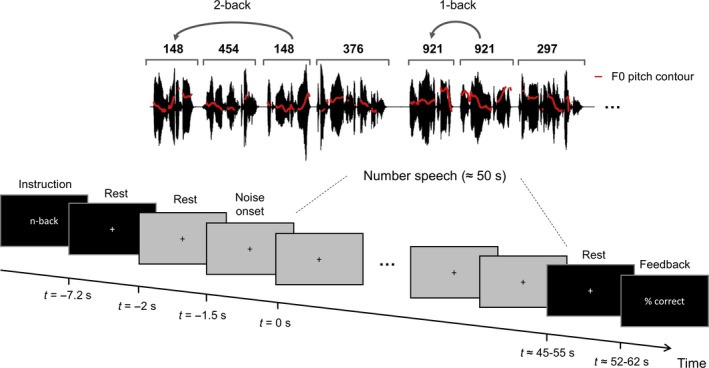
Figure 1.

Schematic illustration of the trial structure and task. Electroencephalogram and pupillometry were recorded, while subjects listened to continuous speech stimuli consisting of spoken number sequences. Red lines on the waveform represent the pitch contour of the continuous speech signal. In different trials, listeners identified either 1‐back or 2‐back number targets in different levels of background noise. Please see the Methods section for details.
