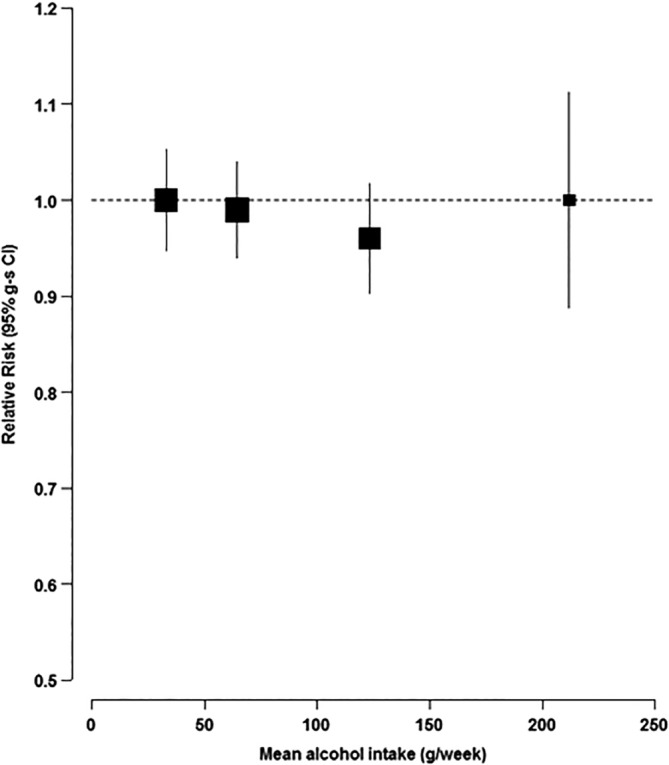
Figure 1.

Multivariable‐adjusted RR of PD by alcohol intake among drinkers, excluding the first 10 years of follow‐up. The multivariable‐adjusted RR (95% g‐s CI) for each of the drinking categories (1–2, >26, >6–14, or > 14 drinks per week) are plotted against the repeat measurement of alcohol intake 14 years later for each category (33, 63, 121, and 208 g/week, respectively).
