Figure 2.

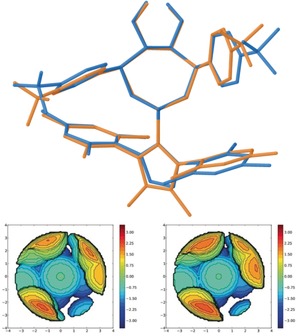
Overlay of the X‐ray structures of 5 c (blue) and 6 c (orange) seen from the Cl‐Au‐P axes; only the inward orientated p‐(CF3)Ph groups are shown for clarity. Steric maps for 5 c (left) and 6 c (right); %V Bur; 5 c, 46.1 % and 6 c, 47.8 %.

Overlay of the X‐ray structures of 5 c (blue) and 6 c (orange) seen from the Cl‐Au‐P axes; only the inward orientated p‐(CF3)Ph groups are shown for clarity. Steric maps for 5 c (left) and 6 c (right); %V Bur; 5 c, 46.1 % and 6 c, 47.8 %.