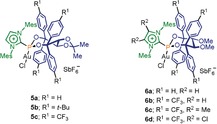
Table 1.
Ligand and substrate optimization.

|
Entry |
Substrate |
Catalyst |
Yield [%][a] |
ee [%][b] |
|---|---|---|---|---|
|
1 |
1 a |
5 a |
90 |
(+) 2 |
|
2 |
1 a |
5 b |
93 |
0 |
|
3 |
1 a |
5 c |
91 |
(+) 30 |
|
4 |
1 a |
6 a |
85 |
(−) 38 |
|
5 |
1 a |
6 b |
83 |
(−) 50 |
|
6 |
1 a |
6 c |
90 |
(−) 95 |
|
7 |
1 a |
6 d |
86 |
(−) 88 |
|
8 |
2 a |
6 c |
90 |
(−) 97 |
|
9 |
2 a |
6 d |
87 |
(−) 95 |
|
10 |
1 b |
6 c |
81 |
(−) 64 |
 All reactions were conducted on a 0.25 mmol scale in DCM (0.05 m). [a] Yields are that of isolated product; [b] ee values were determined by chiral HPLC.
