Figure 1.

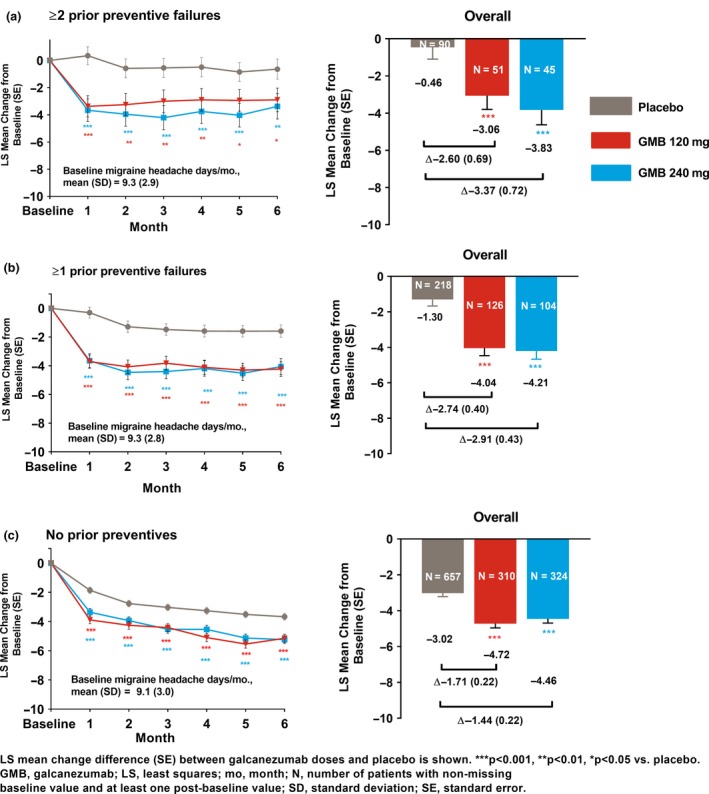
Monthly and overall LS mean changes from baseline in the number of migraine headache days per month during the treatment period. [Colour figure can be viewed at http://wileyonlinelibrary.com]

Monthly and overall LS mean changes from baseline in the number of migraine headache days per month during the treatment period. [Colour figure can be viewed at http://wileyonlinelibrary.com]