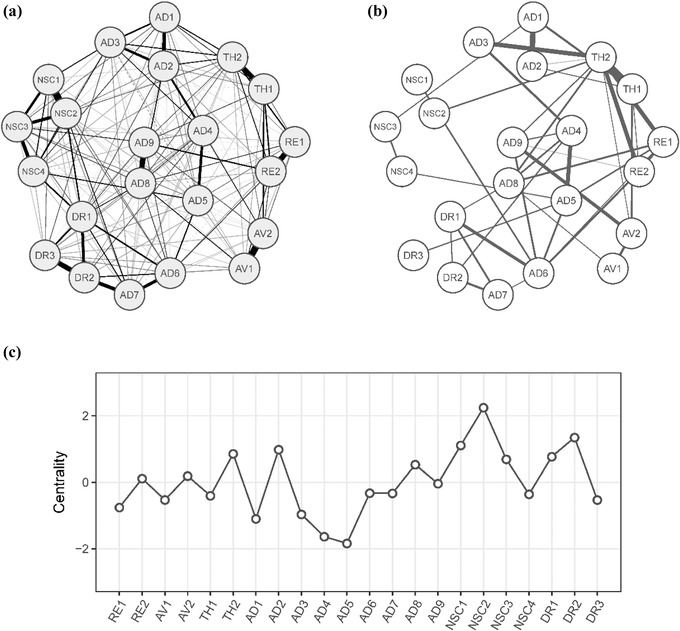
Figure 3.

Network analysis in the combined data set. Cross‐sample network (n = 879; Panel A) depicts the average of the four individual networks; solid edges indicate positive associations, and dashed edges indicate negative relationships. In the cross‐sample variability network (Panel B), each edge depicts the standard deviation of this edge across the four networks. Panel C shows standardized node strength centrality for the cross‐sample network. RE1 = distressing dreams; RE2 = intrusive recollections; AV1 = internal avoidance; AV2 = external avoidance; TH1 = hypervigilance; TH2 = exaggerated startle response; AD1 = heightened emotional reactivity; AD2 = long‐time upset; AD3 = emotional vulnerability; AD4 = anger; AD5 = reckless behavior; AD6 = emotional numbing; AD7 = inability experiencing positive emotions; AD8 = derealization; AD9 = depersonalization; NSC1 = feelings of failure; NSC2 = feelings of worthlessness; NSC3 = feelings of shame; NSC4 = feelings of guilt; DR1 = feeling distant or cut off from others; DR2 = difficulties feeling close to others; DR3 = avoidance of relationships.
