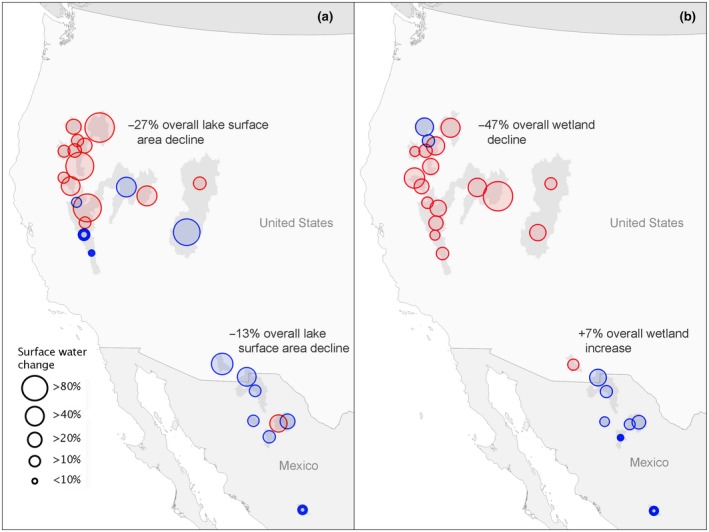
Figure 2.

Magnitude of surface water change for 26 endorheic watersheds between 1984–1999 and 2000–2018. Change is partitioned by lakes (a) and wetlands (b). Statistically significant (p < .05) declines are shown in red and insignificant declines shown in blue. Increases to surface water area are shown in bold blue outline
