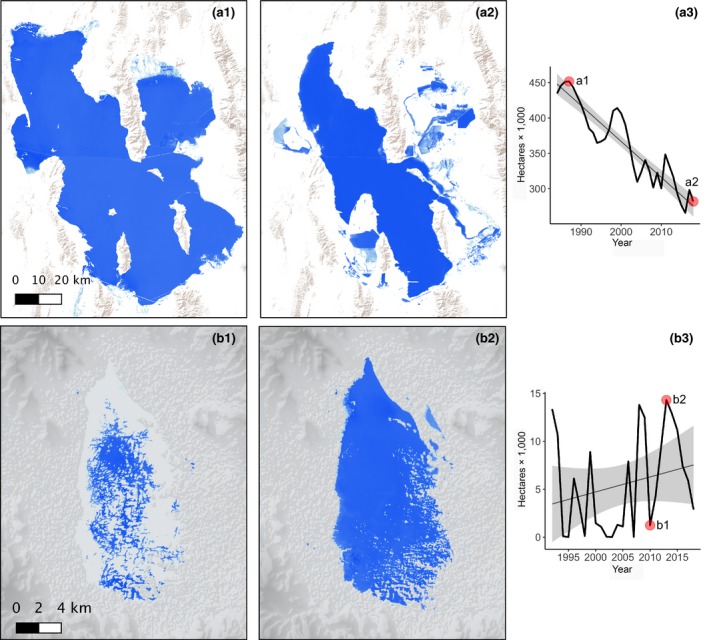
Figure 4.

Annual time series surface water model example for Great Salt Lake, Utah, USA (a) and Laguna de Babicora, Chihuahua, Mexico (b). Graphs (a3, b3) depict patterns characteristic of lake trends in snowmelt (a) and monsoonal (b) watersheds. The thin black lines are the least squares regression lines with the 0.95% confidence interval of the slope shown in gray fill. Red points identify the first and last image of the period of lake conditions depicted (a1 = 1985, a2 = 2018; b1 = 2010, b2 = 2014)
