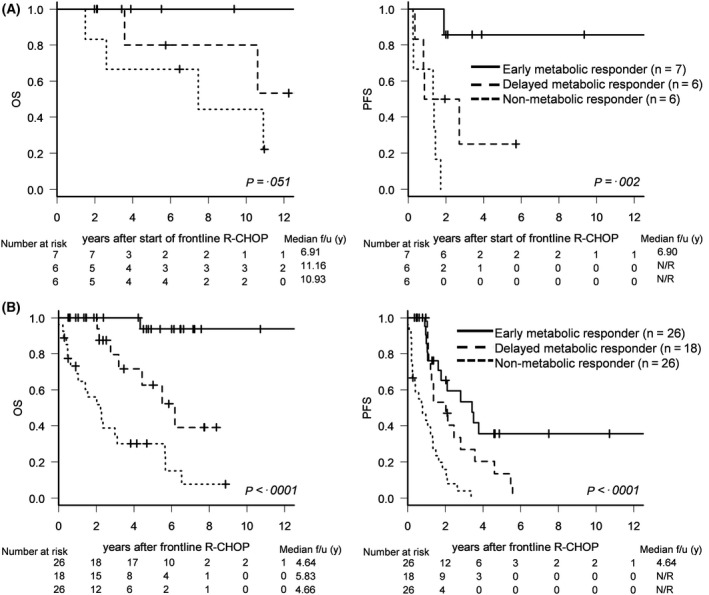
Figure 4.

Survival outcomes according to serial changes in PET response. (A) OS and PFS according to serial changes in PET positivity in the young and fit autologous haematopoietic stem transplantation (auto‐HSCT) subgroup (n = 19). (B) OS and PFS according to serial changes in PET positivity in the unfit or elderly auto‐HSCT subgroup (n = 70).
