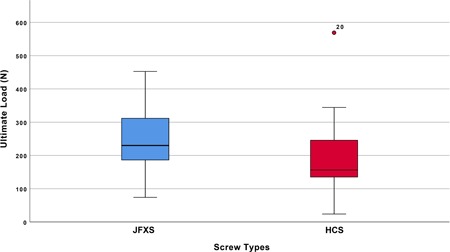
Figure 4.

Box plots representing the ultimate load to failure, in Newton, per screw. The horizontal line indicates the median, the box extends from the 25th to the 75th percentile, and the bars indicate the largest and smallest observed value. [Color figure can be viewed at wileyonlinelibrary.com]
