
Figure 1.
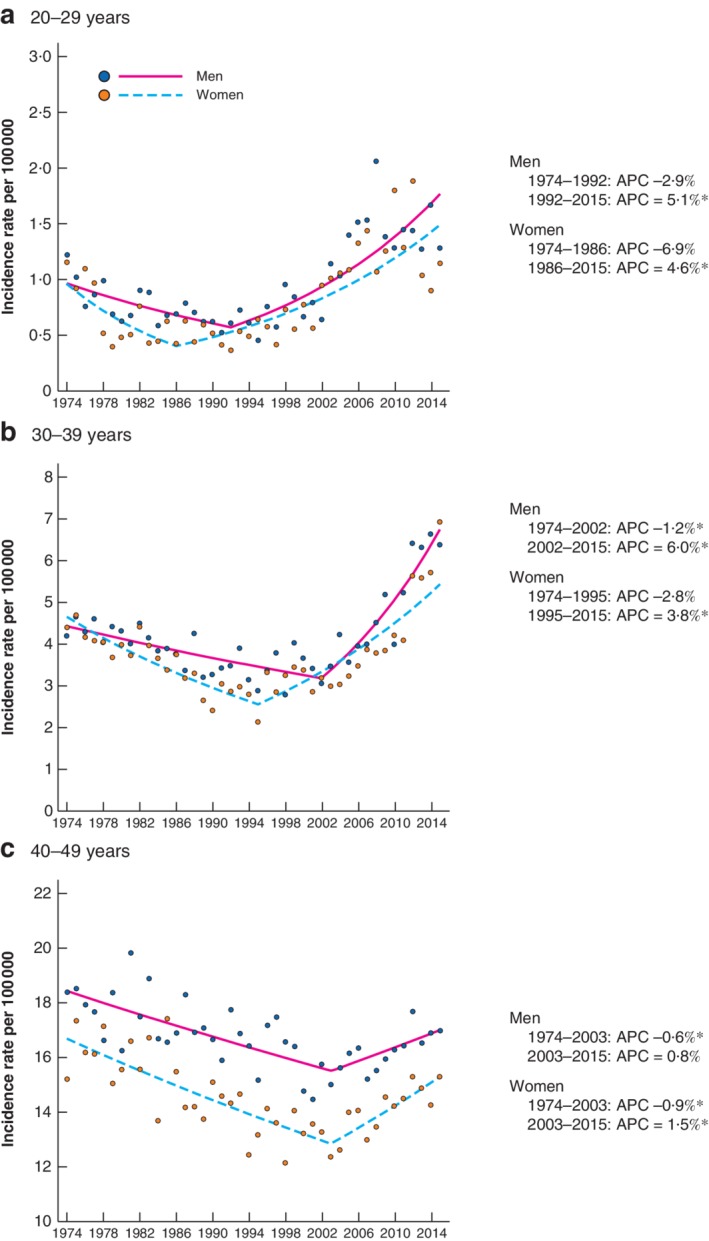
Age‐specific incidence of colorectal cancer in England stratified by sex: 1974–2015 Age‐specific incidence rates for men and women: a 20–29 years, b 30–39 years and c 40–49 years. Incidence rates per 100 000 are shown for each year; the range of values plotted on the y‐axis varies according to magnitude of incidence rate, to highlight trends. Plotted lines indicate annual percentage changes (APCs). *Significant change in APC versus 0 (P < 0·050) using the permutation model of logarithmically transformed data.