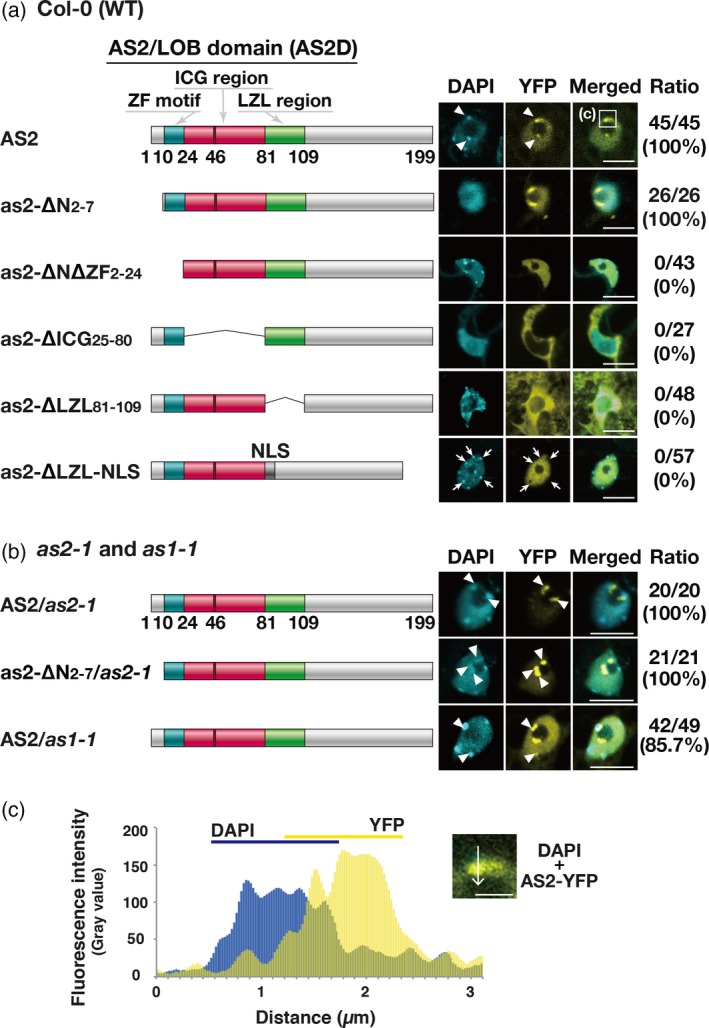
Figure 2.

The zinc‐finger motif is required for localization of AS2 to AS2 bodies and the ICG and LZL regions are required for nuclear localization of AS2.
(a. left) Schematic representation of AS2 and variant proteins with deletions in the AS2/LOB domain. DNA constructs encoding mutant proteins were fused to the sequence encoding to the N‐terminus of YFP and these fused constructs were linked to the estrogen‐inducible promoter. See text for details. (a. right) Images showing the signals from YFP fusion proteins in Arabidopsis plants (Col‐0) transformed with these DNA constructs. Three to five independent transgenic lines were established for analysis of AS2‐YFP and each as2‐variant‐YFP: four lines for AS2‐YFP; five lines for as2‐∆N2‐7‐YFP; and three lines each for as2‐∆N∆ZF2–24‐YFP, as2‐∆ICG25–80‐YFP, as2‐∆LZL81–109‐YFP and as2‐∆LZL‐NLS‐YFP. Expression of these genes was induced as described in the legend to Figure 1. Four to 27 cells that were YFP‐positive were observed in the adaxial epidermis of cotyledons of each transgenic line, as described in the legend to Figure 1. Signals due to DAPI (cyan), those due to YFP (yellow) and merged images in representative cells are shown. Numbers on the right side of the images show the ratios of total numbers of AS2 body‐positive cells to total numbers of YFP‐positive cells, which were obtained by adding the numbers of cells from the analysis of each transgenic line. Arrows in the sixth row (as2‐∆LZL‐NLS) show DAPI‐positive granules overlapping YFP‐negative areas. Bars, 10 µm. (b, left) Schematic representation of AS2 and as2‐∆N2–7. (b, right) Images showing the signals from YFP fusion proteins in as2‐1 and as1‐1 plants. Three transgenic lines were selected for analysis of fluorescence, which was visualized as described above. Signals due to DAPI (cyan) and YFP (yellow) and merged images are shown. Numbers on the right show the ratios of total AS2 body‐positive cells to total YFP‐positive cells in each transgenic line, counted as described above. Chromocenters and AS2 bodies that partially overlapped one another are indicated by white arrowheads. In (a) and (b), bars, 10 µm. (c) Partial overlap of the DAPI signal from the chromocenter with the YFP signal from an AS2 body formed by AS2‐YFP. The inset is a magnified view of the boxed region in panel a (top right, labeled c). Bar, 3 µm. Intensities of fluorescence signals due to YFP and DAPI were measured along the white arrow with ImageJ software (https://imagej.nih.gov/ij/).
