
Figure 5.
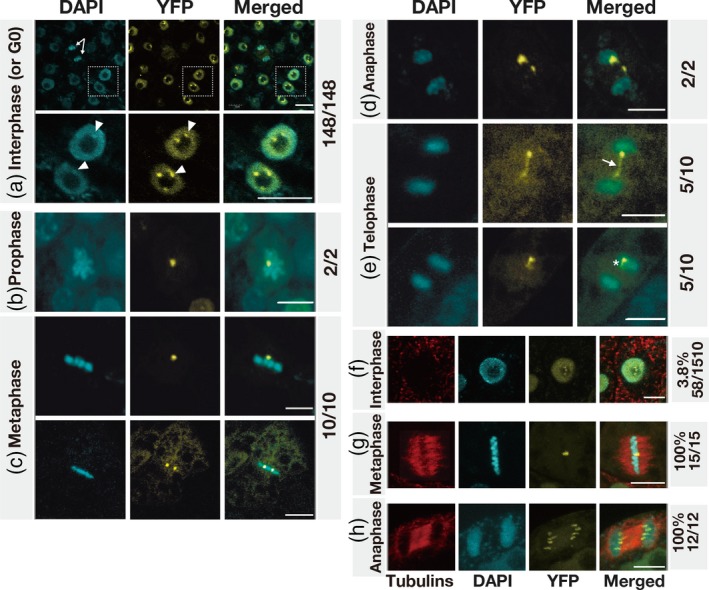
Subcellular localization of AS2‐YFP in interphase and M phase cells in leaf primordia and cultured cell line MM2d.
Expression of AS2‐YFP was induced by incubating 7‐day‐old seedlings of transgenic Arabidopsis plants with 0.05 µm 17β‐estradiol for 16 h (see Experimental Procedures). Seedlings were fixed in 3.7% paraformaldehyde, and chromosomes and nuclei were stained with DAPI. Fluorescence due to DAPI (cyan) and that due to YFP (yellow) was visualized by confocal fluorescence microscopy. Merged images of fluorescence due to DAPI and YFP are also shown. Stages of interphase (or G0, the differentiated phase) (a) and mitotic phases [panels (b–e)] were defined in terms of patterns of staining with DAPI. Panel (a) (top row) shows many interphase (or G0) cells and one anaphase cell (indicated by the white arrows) and magnified views of the boxed nuclei are shown in the lower row. Chromocenters and AS2 bodies that partially overlapped one another are indicated by white arrowheads. Images in (b–e) are seven‐image stacks from an individual sample or cell. The white arrow and the asterisk in (e) indicate a bridge‐like and a tail‐like structures, respectively (see text). The subcellular localization of AS2‐YFP in cells of the MM2d cultured cell line was analyzed similarly, as shown in (f–h). Cells were incubated for 16 h in the presence of 0.05 µm 17β‐estradiol and fixed as described above. Phases of the cell cycle were determined by fluorescence immunostaining of microtubules with antibodies raised in mouse against α‐tubulin from chicken and staining of chromosomal DNA with DAPI. Fluorescence from tubulins, DAPI and YFP was visualized by fluorescence microscopy as described in Experimental Procedures. Merged images (tubulin, red; DAPI, cyan; YFP, yellow) are shown on the right. Phragmoplast microtubules were observed between separating chromosomes (h). Numbers on the right represent ratios of AS2‐body‐containing cells to total YFP‐positive cells at each mitotic phase. Bars, 5 μm.