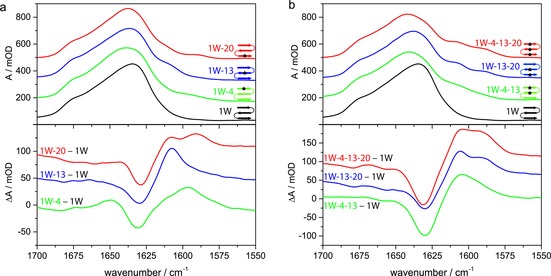
Figure 2.

A comparison of the IR absorption spectra of the amide I′ band (top) and difference spectra in which the unlabeled variant is used as a reference subtracted from the others (bottom): a) Single‐labeled variants 1W‐4 (green), 1W‐13 (blue), and 1W‐20 (red) in comparison with the unlabeled variant 1W (black). b) Multiple‐labeled variants 1W‐4–13 (green), 1W‐13–20 (blue), and 1W‐4–13–20 (red) in comparison to the unlabeled variant 1W (black). The spectra were acquired in D2O at 10 °C and normalized to the band integral between 1700 and 1570 cm−1. Difference spectra were obtained by subtracting the normalized absorbance signal of the unlabeled variant to better show the presence, relative intensities, and positions of the labeled modes. Data were offset by 150 (top) and 50 mOD (bottom) for better visualization.
