
Figure 6.
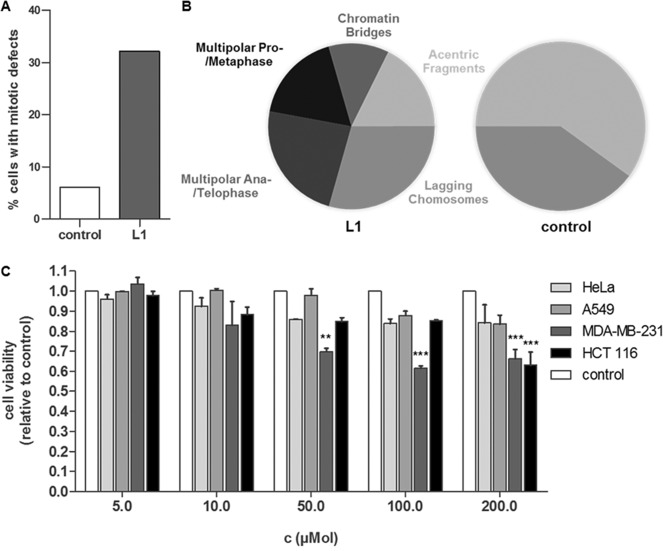
L1 induces mitotic defects in HeLa cells and inhibits cell proliferation. A) Percentage of HeLa cells with mitotic defects in cells treated with 50 μM L1 for 48 h in comparison to the DMSO control. B) Pie charts show proportions of the different mitotic defects found in L1‐treated cells in comparison to DMSO‐treated cells (control). N>100. C) HeLa, A549, MDA‐MB‐231, and HCT 116 cells were treated with different ligand concentrations or the respective amounts of DMSO and incubated for 72 h before cell proliferation was measured via an MTS assay. The measured absorbance at 490 nm in L1‐treated cells was normalized to the absorbance in DMSO‐treated cells of the respective cell type (control). Experiments were performed in triplicate. The error bars show the standard error of the mean. Data was analyzed by a 1way ANOVA test followed by a Tukey's Multiple Comparison test. Two asterisks (**) indicate a p value smaller than 0.01. Three asterisks (***) indicate a p value smaller than 0.001.