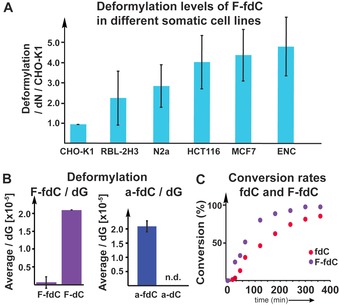
Figure 3.

A) Deformylation data for F‐fdC in different cell types, showing that F‐fdC is deformylated in very different cells. Deformylation rate was calculated by the F‐dC+F‐mdC/dN per F‐fdC/dN, then the values were normalized to the cell line with the lowest deformylation level (CHO‐K1=1). B) The deformylation of F‐fdC/dG and a‐fdC/dG, showing the induced differences due to C6‐carbon‐to‐nitrogen exchange. C) The bisulfite data show that the deformylation of fdC and F‐fdC is comparable, thus showing that the 2′‐F substitution has only a small accelerating effect, whereas the reaction of a‐fdC could not be detected.
