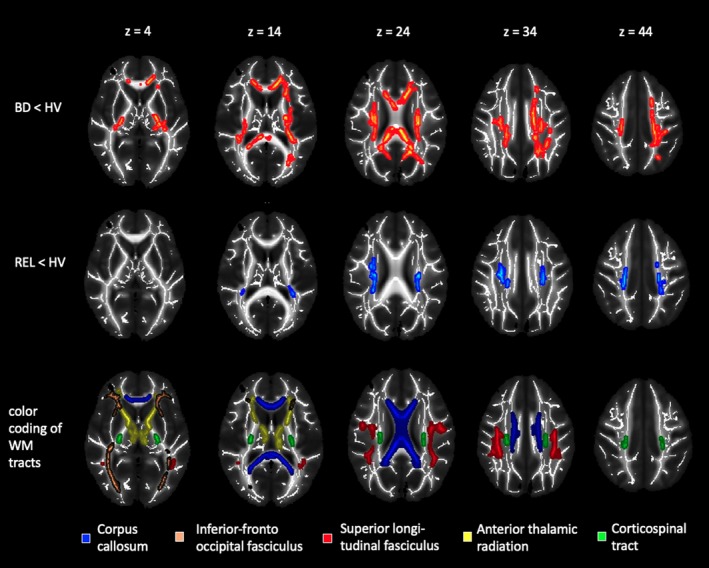
Figure 1.

Visualization of group comparisons. Mean maps of fractional anisotropy (greyscale) and mean fractional anisotropy skeletons (white). Red colored voxels signify decreased fractional anisotropy in patients with bipolar disorder compared to healthy volunteers. Blue colored voxels signify decreased fractional anisotropy in relatives of patients with bipolar disorder compared to healthy volunteers. We used the TBSS‐fill script to improve visualization of the results. Images are shown in radiological convention, that is, the left side of the brain is depicted on the right. Maps are thresholded at P < .05 FWE‐corrected across voxels and correction over contrasts. The lowest panel shows the corpus callosum taken from the ICBM‐DTI‐81 WM labels atlas and the inferior‐fronto‐occipital fasciculus, superior longitudinal fasciculus, anterior thalamic radiation and corticospinal tract from the JHU WM tractography atlas thresholded at 25% overlaid on the mean FA map of this study to help with the interpretation of the significant cluster. FA, fractional anisotropy; WM, white matter
