
Figure 5.
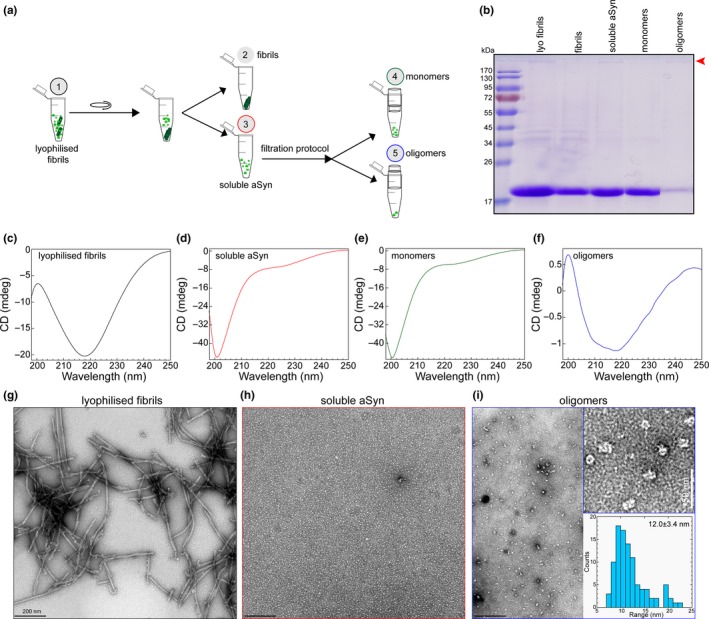
(a) Schematic illustration showing the experimental setup of the centrifugation‐based filtration analysis of lyophilized and resuspended α‐syn fibrils (lyophilized fibrils). (b) sodium dodecyl sulphate–polyacrylamide gel electrophoresis (SDS‐PAGE) analysis of α‐syn samples isolated from the different steps of the protocol. Red arrow head points the band of SDS‐resistant oligomers. (c–f) CD spectra of lyophilized fibrils (c), soluble α‐syn (d), monomers (filtrate, e) and oligomers (retentate, f) in the samples. (g–i) Representative EM images of lyophilized fibrils (g), soluble α‐syn (h), and oligomers (retentate, i) in the samples from the different steps of the protocol. The top insert on (i) is the zoom of the EM images of the oligomer sample. The bottom insert of I shows the distribution of the diameter of oligomeric particles based on the quantification from EM images