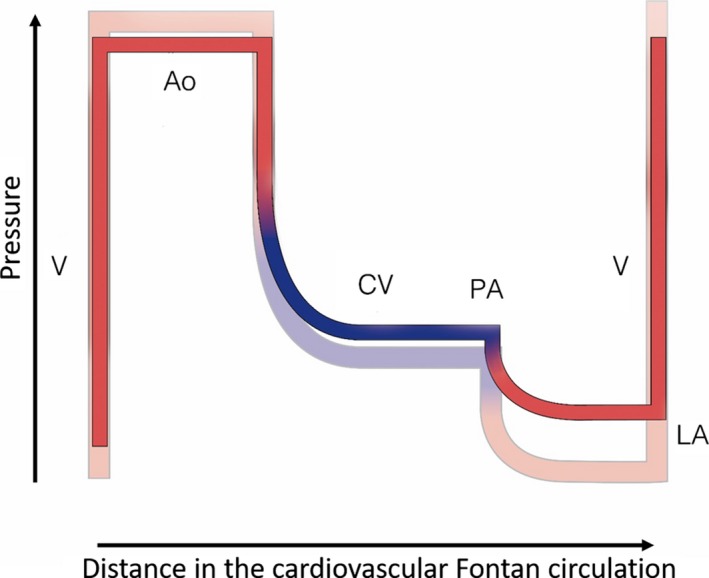
Figure 4.

Flow/pressure/saturation diagram of the Fontan circulation: changes over time. Fontan haemodynamics late (full colour) superimposed on Fontan early (transparent): with time the ventricular end‐diastolic pressure and pulmonary vascular resistance increase, resulting in overall decreased flow and increased caval vein pressure/congestion. A downward progressive spiral ensues. Ao, aorta; CV, caval veins; LA, left atrium; PA, pulmonary artery; V, single ventricle
