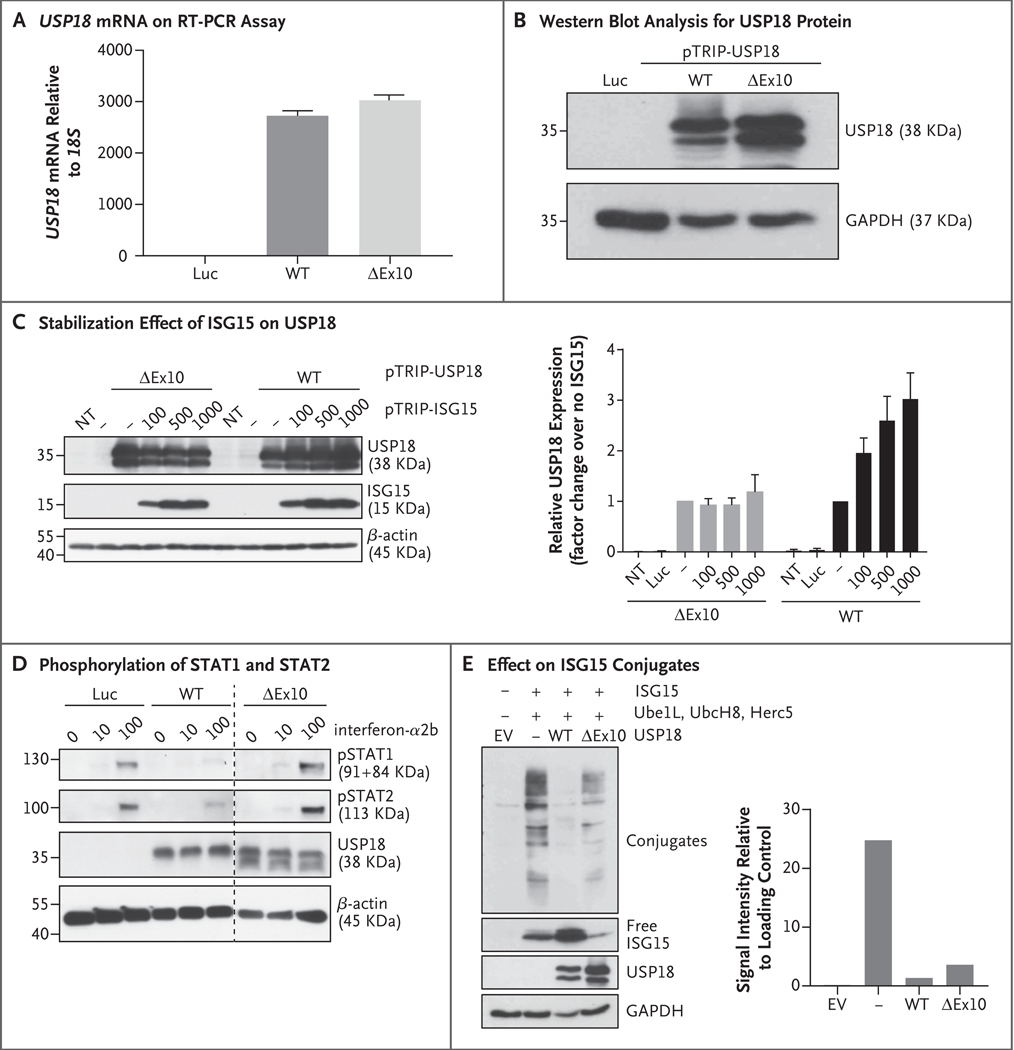
Figure 3. Characterization of the USP18 Allele.
Panel A shows the relative levels of messenger RNA (mRNA), as normalized with the 18S housekeeper gene, in wild-type (WT) USP18 or the c.1073+1G→A (ΔEx10) variant and in a control with lentiviral particles expressing luciferase (Luc), as assayed on quantitative reverse–transcriptase–polymerase chain reaction (RT–PCR) in three independent experiments, each with technical triplicates; the results of a representative experiment are shown. Panel B shows a representative experiment involving cell lysates that were analyzed by Western blotting for the USP18 protein. Panel C shows HEK293T cells that were transfected with wild–type USP18 or the ΔEx10 variant, together with various amounts of pTRIP–ISG15 (graph at the left). Cell lysates were analyzed by Western blotting with the antibodies indicated. The graph at the right shows the densitometric analysis of USP18 protein expression levels normalized over an endogenous control. T bars represent the standard error of three independent experiments. NT denotes not transfected. Panel D shows HEK293T cells that were transduced with wild–type USP18, the ΔEx10 variant, or Luc. Twenty–four hours later, the cells were treated with the indicated concentrations of interferon–α2b for 20 minutes. Cell lysates were analyzed by Western blotting with the antibodies indicated. Samples were run on the same gel, and extra lanes were deleted to remove irrelevant data, as indicated by the vertical dashed line. Panel E shows HEK293T cells that were cotransfected with ISG15 and E1, E2, and E3 enzymes for ISG15 (Ube1L, UbcH8, and Herc5) in combination with the different variants of USP18. The graph at the right shows the densitometric analysis of ISGylated proteins normalized over an endogenous control. Cell lysates were analyzed by Western blotting with the antibodies indicated. The results of a representative experiment are shown. EV denotes empty vector.

