Figure 3.
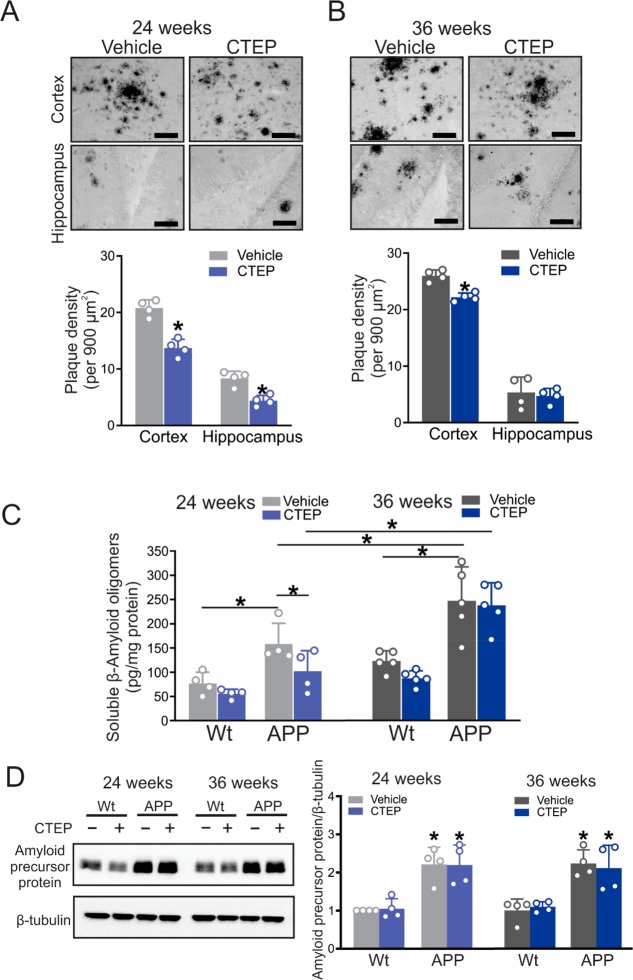
CTEP treatment for 24, but not 36, weeks reduced Aβ pathology in APPswe/PS1ΔE9 mice. Representative images of Aβ staining and quantification of plaque density in cortical and hippocampal brain slices from age-matched APPswe/PS1ΔE9 (APP) mice following treatment with either vehicle or CTEP (2 mg/kg) for (A) 24 or (B) 36 weeks. Images are representative of four independent experiments (scale bar, 50 μm). Data represent mean ± SD following the quantitation of five different 900 μm2 regions in the cortex and two different 900 μm2 regions in the hippocampus from six brain slices in four independent mice for each group. *P < 0.05 versus the same region of vehicle-treated age-matched APP mice. Statistical significance was assessed by unpaired Student’s t test. (C) Mean ± SD of the whole-brain Aβ oligomer concentrations (pg/mg protein) in age-matched wt and APP mice after either a 24 week or 36 week treatment with either vehicle or CTEP (n = 4–5). The asterisk (∗) denotes significant difference at P < 0.05. (D) Representative Western blots and quantification of folds change in Amyloid precursor protein with the corresponding β-tubulin loading control from age-matched wt and APP mice after either a 24 week or 36 week treatment with either vehicle or CTEP (n = 4). Values represent mean ± SD and were expressed as a fraction of the 24 week, vehicle-treated wt value. *P < 0.05 versus 24 week, vehicle-treated wt mice. Statistical significance for panels C and D was assessed by two-way ANOVA and Fisher’s LSD comparisons.

