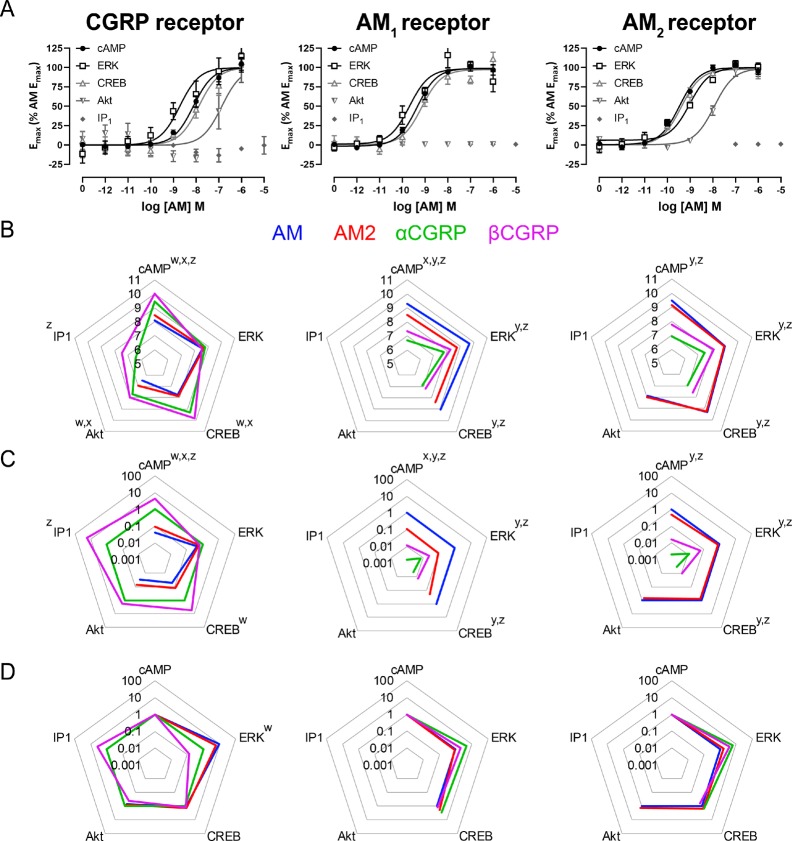
Figure 2.
(A) activation of signaling pathways at the corresponding receptor by full-length AM, (B) Summary pEC50 values for the activation of signaling pathways at the corresponding receptor by AM, AM2, αCGRP, and βCGRP, (C) Δτ/KA values for pathway activation at the corresponding receptor, (D) ΔΔτ/KA values for pathway activation at the corresponding receptor. This figure shows results from transfected Cos7 cells. Results in panel A represent the mean ± s.e.m. of three or five independent experiments (flat-lines or curves, respectively). Results in panels B, C, D show the mean of at least five independent experiments for which a pathway could be measured. Results in panels C and D are presented as fold change relative to a reference ligand (αCGRP at the CGRP receptor, or AM at the AM1 and AM2 receptors). Results in panel D are normalized to a reference pathway (cAMP in all cases); in panel D, a value >1 indicates bias toward the named pathway over cAMP production. See Tables S2 to S6 and Figures S6 to S10 for all curves and values. Results in panels B and C analyzed by paired Student’s t tests (IP1 production at the CGRP receptor, Akt phosphorylation at the AM2 receptor), or repeated measures ANOVA with posthoc Tukey’s test (all other pathways). Results in panel D analyzed by one-way ANOVA with posthoc Dunnett’s test, comparing the ability of a peptide to activate a pathway relative to cAMP. A superscript letter above a pathway represents a significant (p < 0.05) difference between reference ligand and named ligand (panels B and C), or a significant difference between the named pathway and cAMP production (panel D). Superscript “w” indicates a significant difference for AM, “x” indicates a significant difference for AM2, “y” indicates a significant difference for αCGRP, and “z” indicates a significant difference for βCGRP.

