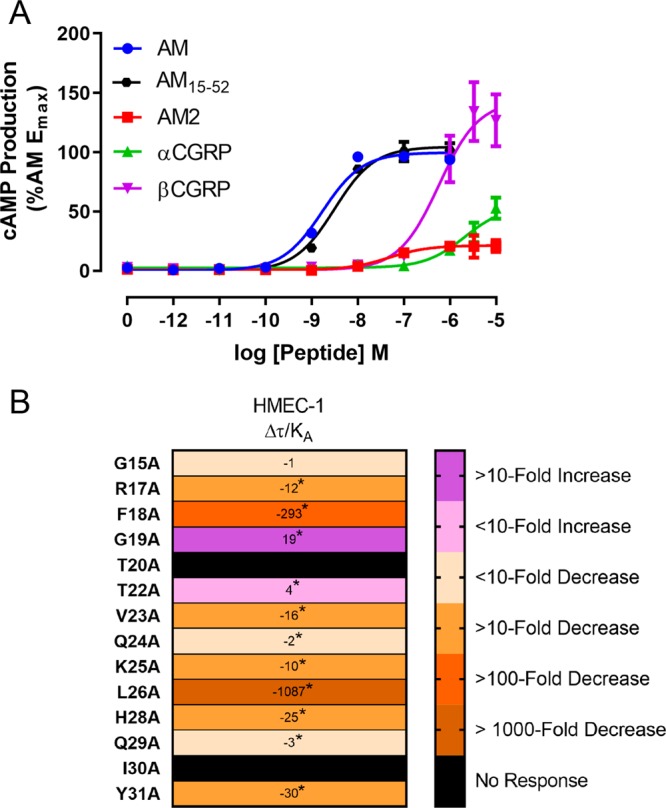
Figure 6.

(A) cAMP production stimulated by endogenous peptides in HMEC-1 cells. Data points are the mean ± s.e.m. of seven independent experiments for all peptides except for AM2, which is n = 6, and AM15–52 which is n = 5. There was one other experiment where AM2 was unable to elicit a measurable response, and this experiment has been excluded from the current data set. For values derived from these curves, see Tables S19 and S21 and Figure S45. (B) relative effectiveness (Δτ/KA values) for alanine-substituted analogues of AM15–52 stimulating cAMP production in HMEC-1 cells. Values are presented as fold-change relative to AM15–52. Analogues were compared to AM15–52 using paired Student’s t-tests; this analysis was used because the experimental design created a paradigm in which the results from an individual analogue were linked to only the AM15–52 included on each plate, and not to the values of other peptides. The asterisk (∗) indicates a significant (p < 0.05) difference.
