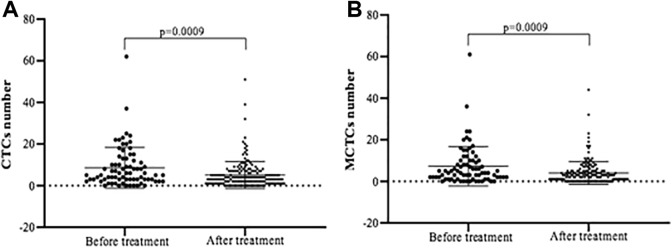
Figure 1.
Comparison of CTC and MCTC number before and after treatment. Panel A: CTC number. Panel B: MCTC number. Vertical axes: positive CTC or MCTC number; horizontal axes: samples collected before and after treatment. CTC indicates circulating tumor cells; MCTC, the CTC that were positive for mesenchymal biomarkers including biphenotypic CTC and mesenchymal CTC.

