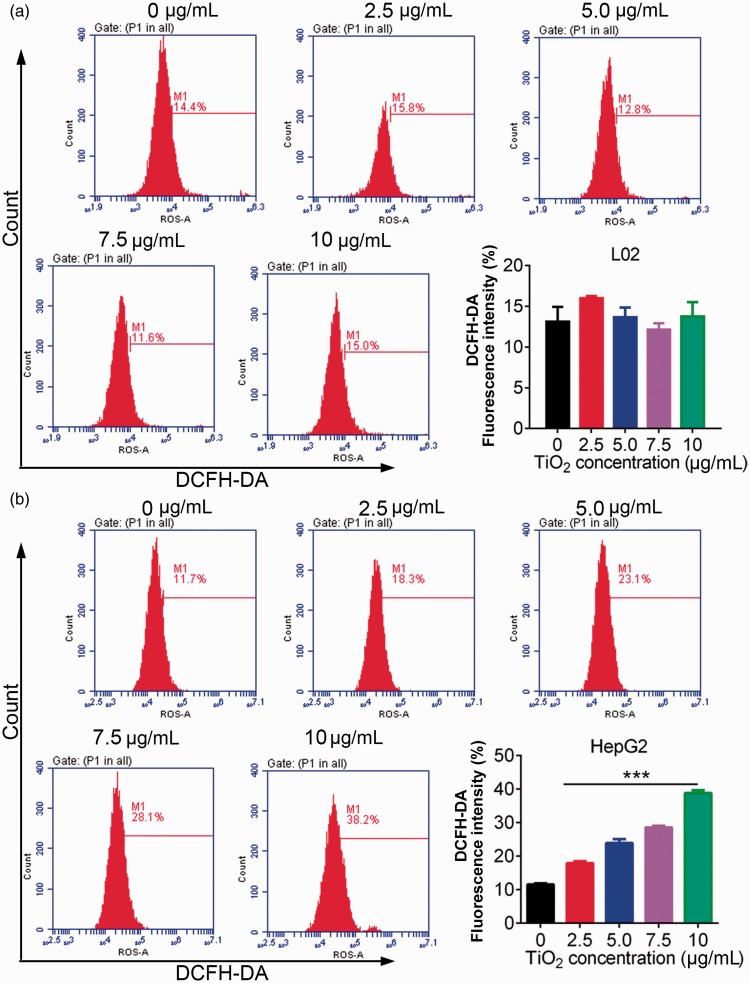
Figure 4.
L02 (a) and HepG2 (b) cells were treated with 0, 2.5, 5.0, 7.5, and 10 µg/mL TiO2, and the cell cycle distribution was then examined by flow cytometry. TiO2 caused release of ROS in liver cancer cells. Cells incubated with 0 µg/mL TiO2 were used as a control. ***P < 0.001 vs. 0 µg/mL (control). DCFDA, 2’,7’-dichlorofluorescin diacetate.

