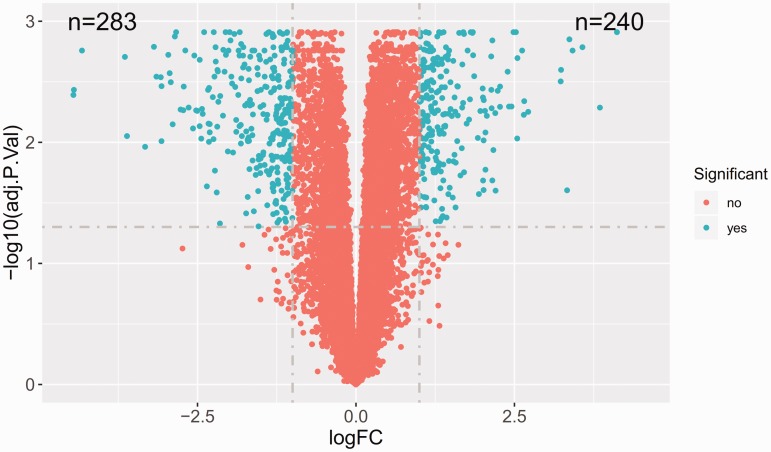
Figure 1.
Volcano plots showing the upregulated and downregulated genes in colorectal cancer tissues. Blue dots represent significant mRNAs with an adjusted P-value < 0.05 and |logFC| > 1. Red dots represent nonsignificant genes. The colour version of this figure is available at: http://imr.sagepub.com.

