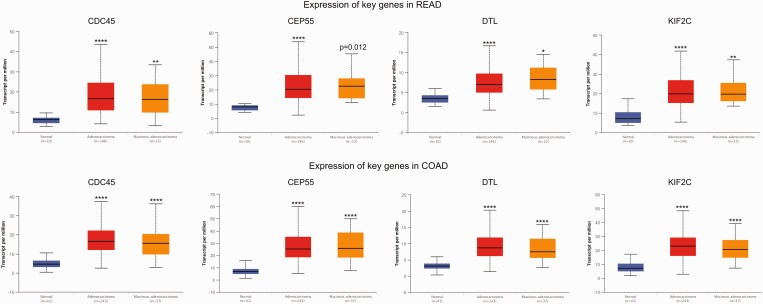
Figure 6.
The expression of key genes in colorectal cancer based on histological subtypes. COAD, colon adenocarcinoma; READ, rectum adenocarcinoma. *P < 0.01, **P < 0.001, ***P < 0.0001, ****P < 0.00001 compared with the normal tissue; t-test. The central black horizontal line is the median; the extremities of the box are the 25th and 75th percentiles; and the error bars represent the minimum and maximum outliers. The colour version of this figure is available at: http://imr.sagepub.com.

