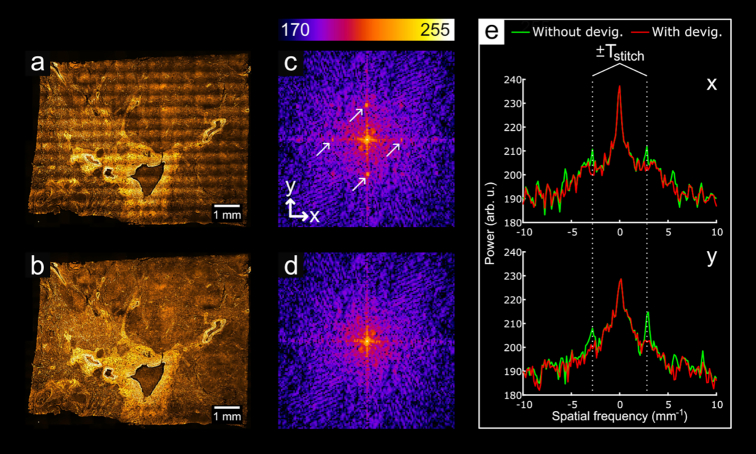
Figure 14:
Analysis of periodic stitching artifacts in the frequency domain. (a) A stitched image where devignetting has not been applied to the tiles; (b), a stitch of devignetted data. (c, d) Central region of the FFTs of (a) and (c), respectively. The arrows in (c) point to the fundamental peaks of the grid artifact. (e) Shows plots of (c) and (d) through the center of each image along the x and y axes. The calculated value for Tstitch aligns well with the peaks along both axes. Arb. u.: arbitrary units; devig.: devignetting.

