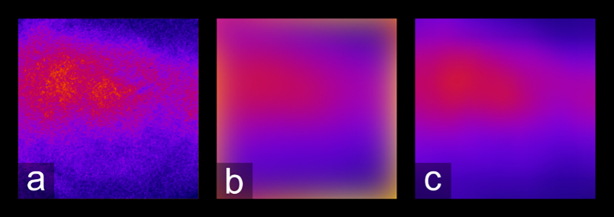
Figure 4:
Edge handling during the blurring process. (a) Result after performing an average intensity projection on a set of MAP-SIM tiles. (b) Shows (a) after being blurred using ImageJ's “Gaussian blur” with a radius of 200 pixels, while (c) shows (a) blurred using the “border limited mean” filter.

