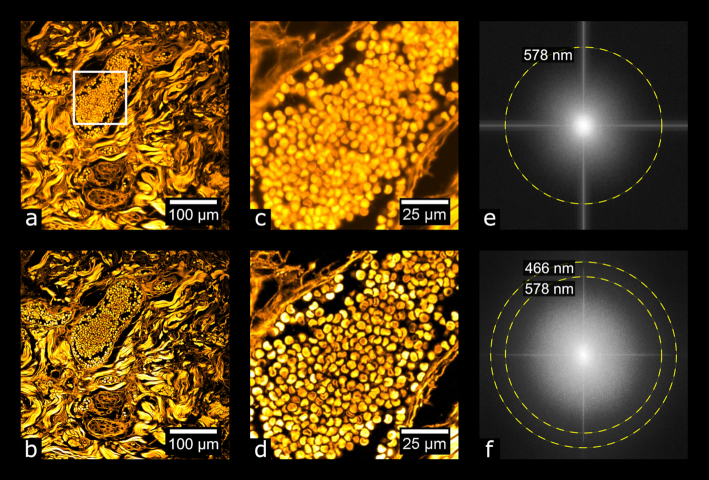
Figure 7:
Evaluating image resolution. (a, b) A tile from the data in Fig. 10 (basal cell carcinoma sample) after wide-field and MAP-SIM reconstruction, respectively. (c, d) Zoom-in of (a) and (b), respectively. (e, f) FFT of (a) and (b), respectively. The dotted lines in (e) and (f) indicate the resolution of each image according to the resolution measurement described.

