Figure 7.
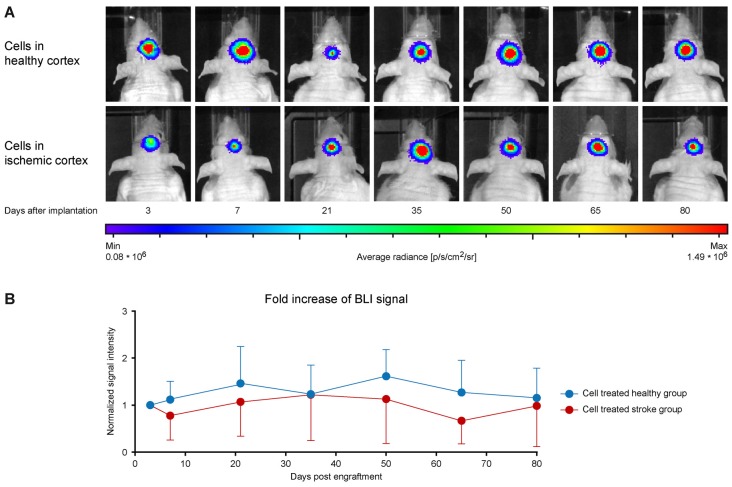
Stem cell vitality over time. (A) The bioluminescence images of representative animals from the healthy mice with stem cell implantation (upper row) and from the animals with stem cell implantation 7 days after stroke (lower row) show in both cases rather stable signal intensities at the seven measurements over the 12 weeks observation. (B) Quantitative analysis of the BLI signal intensities within both groups. BLI intensities were normalized to the first measurement time point after cell engraftment for each animal individually. Data are presented as mean ± standard deviation (SD). No significant changes are observed between both groups and over time. The stable BLI signal intensities demonstrate persistent graft viability during the whole 12 week observation period.

