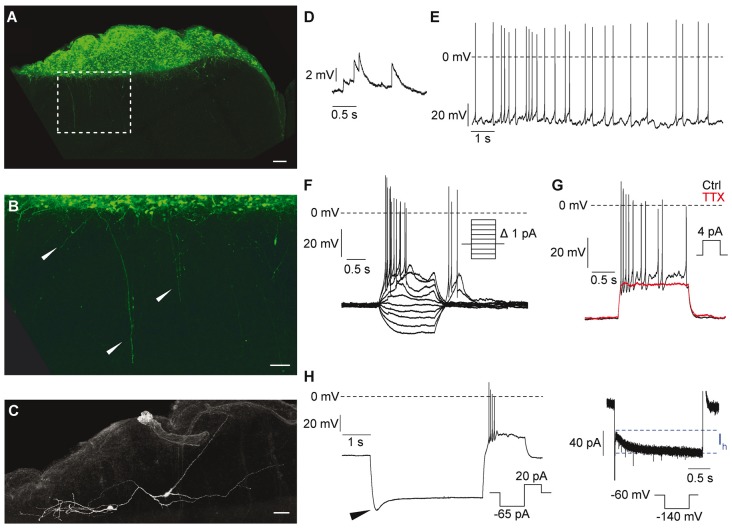
Figure 9.
Electrophysiological and morphological properties of engrafted hNSCs recorded at 16 weeks after stroke induction and 15 weeks after grafting. (A) Enhanced green fluorescent protein (eGFP)-staining of the implanted graft. Scale bar: 100 μm. (B) Higher magnification of the dashed rectangle in (A) showing projections from the graft into the cortex. Scale bar: 50 μm. (C) Biocytin-labeling of recorded cells. Scale bar: 50 μm. (D) Excitatory postsynaptic potentials (EPSP) indicating functional synaptic connection. (E,F) Some cells generated spontaneous action potentials (E), while others generated trains of action potentials only during depolarizing current injections (F). (G) Blocking of action potentials by TTX (1 μM) indicates the expression of voltage-gated Na+ channels. Black trace: control; red trace: TTX. (H) Left: hyperpolarization of the cell to ~−140 mV induced a sag-potential (arrowhead) which is mediated by Ih. Right: Ih elicited by a hyperpolarizing voltage-step to −140 mV.

