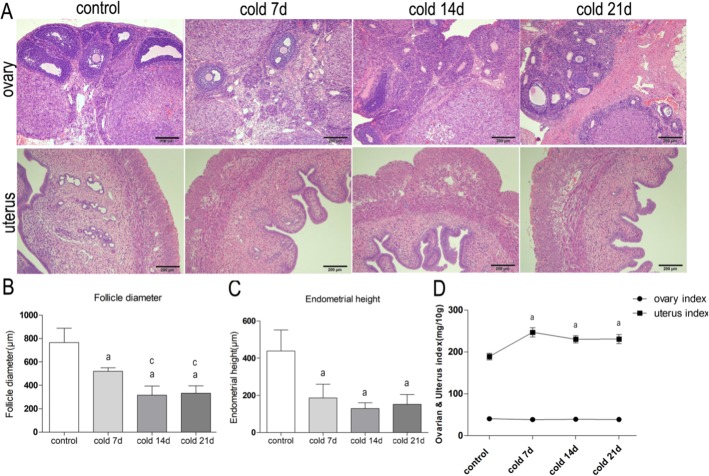
Fig. 3.
a: HE staining of ovary and uterus(100×). Compared with the normal group, the number of primordial follicles and primary follicles in each cold group increased significantly. The diameter of granulosa layer and theca cell layer of ovary decreased obviously. In the cold stimulation groups, the lumen of uterus was narrow, and the lumen epithelium of endometrium was irregular papillary. b: Comparison of ovarian follicle diameter in each group, values are means±SD(n = 3), p < 0.01a vs control, p < 0.01c vs cold 7d. c: Comparison of endometrial epithelial height in each group, values are means±SD(n = 3), p < 0.01a vs control. d: Comparison of ovarian index and uterine index in each group, values are means±SD(n = 3), p < 0.01a vs control

