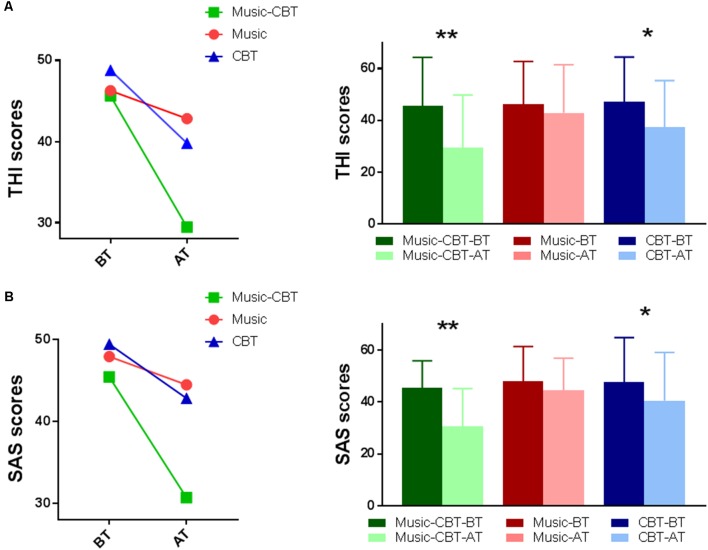
Figure 1.
Split-Plot ANOVAs of the behavioral data. (A) THI results; (B) SAS results; Left: interaction effect of Group × Time Of Test. Right: simple effects of BT vs. AT for each group. *indicates a significance level of p < 0.025, and **Indicates p < 0.001. Abbreviations: CBT, cognitive behavioral therapy; BT, before-treatment; AT, after-treatment; THI, tinnitus handicap inventory; SAS, self-rating anxiety scale.

