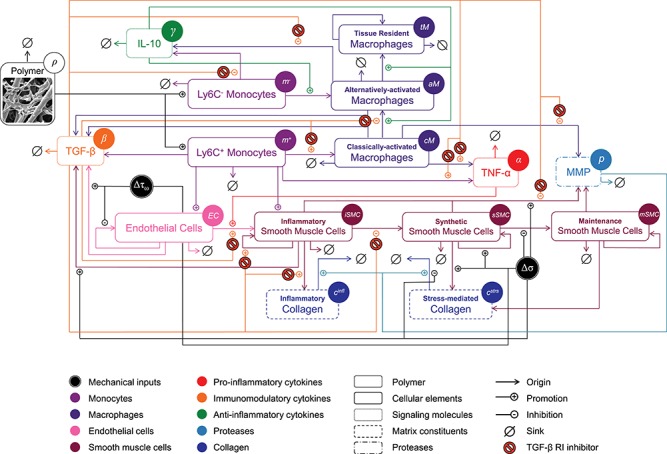
Figure 2.

The BCM model of TEVG development, represented graphically using a schematic similar to that originally developed by [13]. The model is shown following pharmacological intervention with a TGF-β R1 inhibitor. Legend and color scheme for the mechanistic pathways are below the figure, and variables used in the governing equations can be found within circles next to the name of each element in the diagram. See text for further details.
