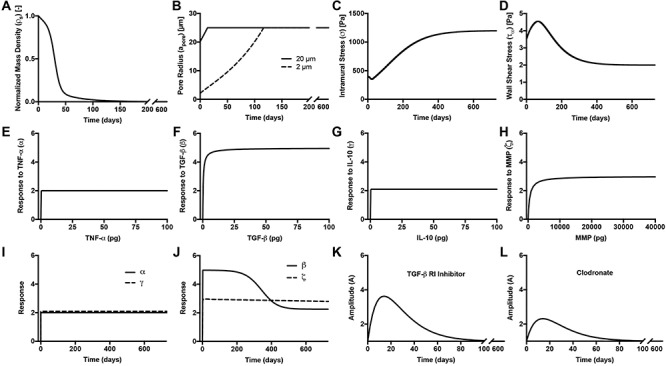
Figure 3.

(A–D) Inputs for the BCM model. (A) Normalized polymer mass density (ρs (t)), which captures the degradation of the PGA felt in the first 6 weeks and the loss of the P(CL/LA) sealant over 6 months. (B) Evolving pore size (apore (t)) for two different scaffold designs with an initial pore radius of 20 μm (solid line) or 2 μm (dashed line). (C) Intramural stress (σ(t)) and (D) wall shear stress (τω (t)) profiles were generated using our previous phenomenological G&R framework [30]. (E) Response to TNF-α (parameter α) as a function of the quantity of TNF-α. (F) Response to TGF-β (parameter β) as a function of the quantity of TGF-β. (G) Response to IL-10 (parameter γ) as a function of the quantity of IL-10. (H) Response to MMPs (parameter ζ) as a function of the quantity of MMPs. (I) Values of parameters α and γ throughout the baseline simulation; both parameters are fixed. (J) Values of parameter β and parameter ζ throughout the baseline simulation. Notice that the MMP response function (dashed line) remains maximally activated throughout the baseline simulation, whereas the TGF-β response function (solid line) decays following degradation of the polymeric scaffold. (K) Gamma function used to model the administration of TGF-β RI inhibitor. (L) Gamma function used to model the administration of clodronate.
