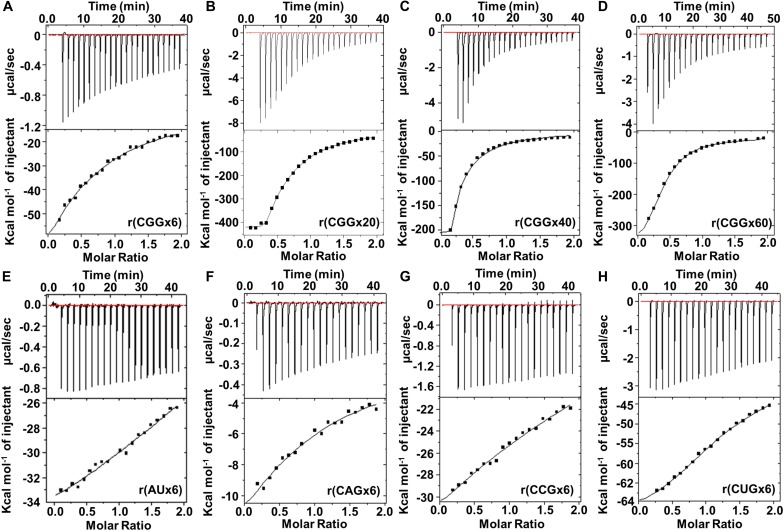
FIGURE 2.
Isothermal calorimetry titration of Curcumin with different mismatched and fully paired RNAs. (A) r(CGGx6), (B) r(CGGx20), (C) r(CGGx40), (D) r(CGGx60) and (E) r(AUx6), (F) r(CAGx6), (G) r(CCGx6), and (H) r(CUGx6) represents the thermogram of respective RNA with Curcumin. The exothermic peaks represent the favorable contribution of energy during interactions. Two-mode ligand binding saturation model was used to fit the plots.

