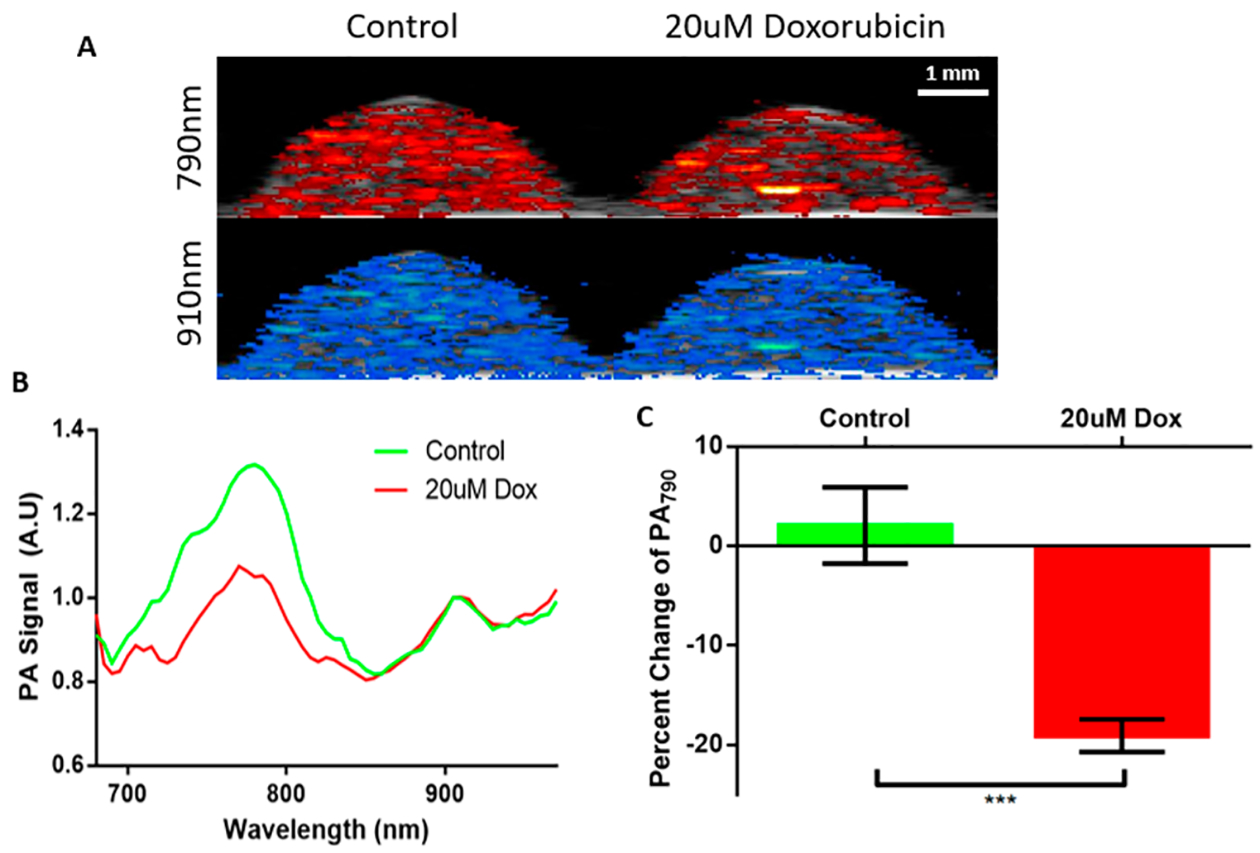
Figure 5.

Validation of the nanoparticle in stem cells. (A) PA images are overlaid with corresponding B-mode ultrasound images. At 790 nm the control group has a slightly higher signal compared to the doxorubicin treated group. At 910 nm both groups have a similar signal. (B) The PA spectra display the dye and AuNR peaks. The AuNR peak is unchanged while the dye peak is reduced in the stem cells treated with doxorubicin. (C) Quantification of the reduced signal displays a negligible change in the control group and an 18% decrease in signal for the doxorubicin treated stem cells. *** p < 0.005.
