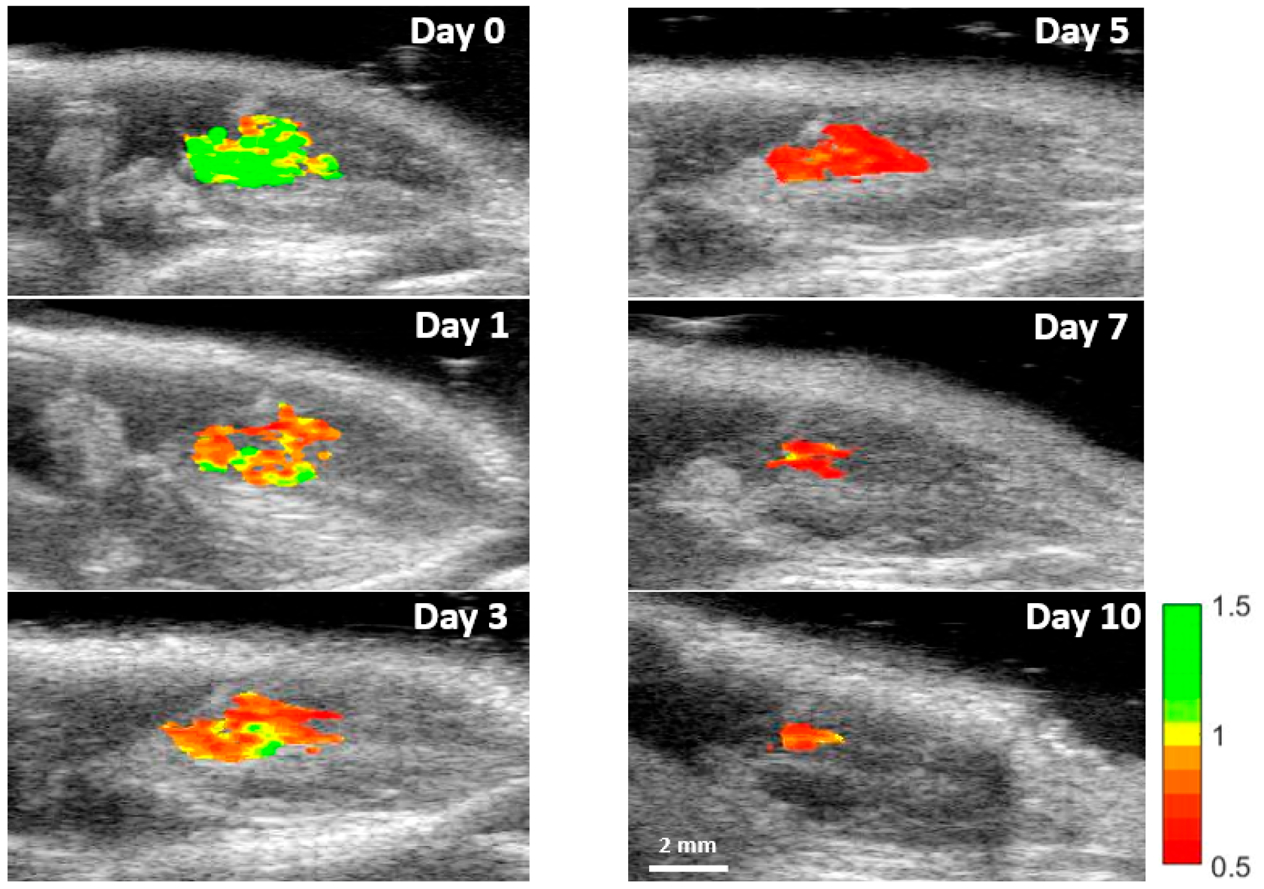
Figure 7.

Ratiometric imaging of stem cell viability in vivo. PA images of day 0, 1, 3, 5, 7, and 10 at 795 and 920 nm were obtained, and the ratiometric images were created. The surrounding tissue signal was subtracted to better visualize the change in stem cell viability during the study. Reduction in ratio and signal is visible.
