Figure 8.

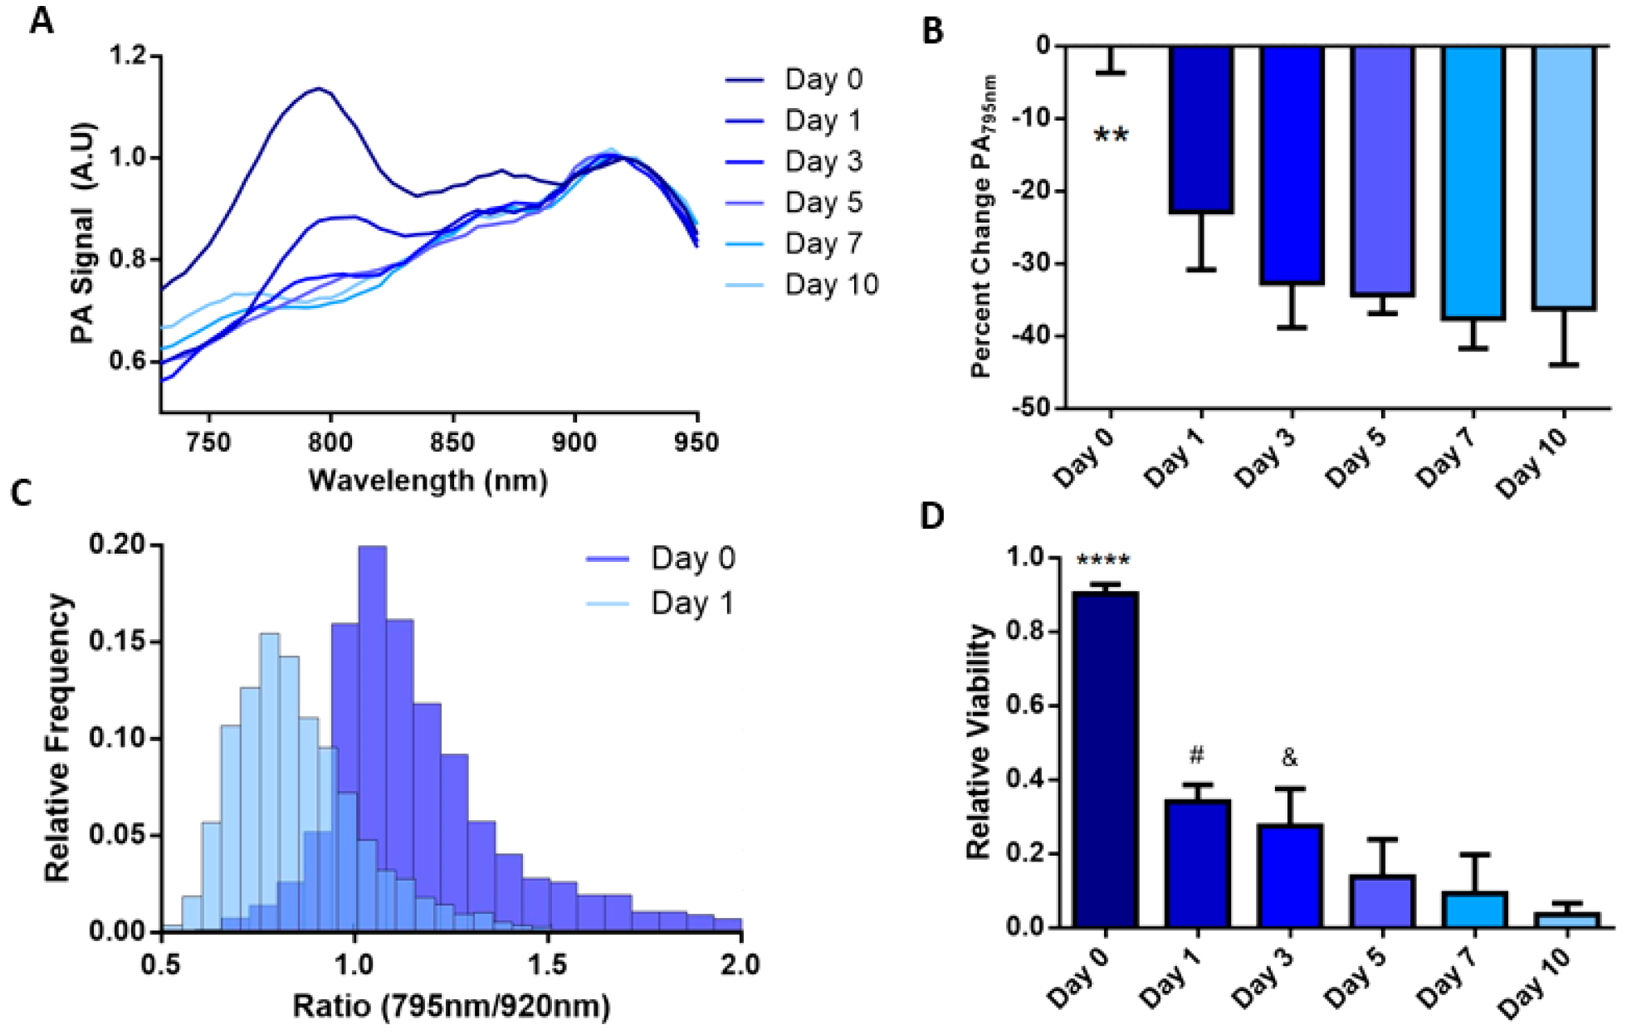
Analysis of the photoacoustic in vivo stem cell viability study. (A) PA spectra changes over the studies duration; the IR775c peak gradually decreases over time. (B) Quantification of the IR775c peak displays a reduction in signal by 22% on day 1 and steady 30–35% reduction on days 3–10. ** p < 0.01 compared to days 1–10. (C) Histogram of ratiometric data for days 0 and 1 show two distinctive groups with small overlap. A break at 0.95 was used to separate the two groups, with ratios greater than 0.95 signifying living cells and below 0.95 indicating dead cells. (D) Each time point is quantified to display relative viability with 92% viable cells on day 0 to 5% viable by day 10. **** p < 0.0001 compared to all days. # p <.05 compared to day 7 and 10. & p < 0.05 compared to day 10.
