
Figure 1.
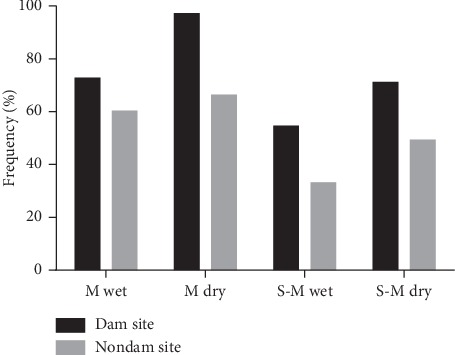
Parasite prevalence by microscopy and PCR. Frequency distribution of the prevalence of P. falciparum by microscopy and PCR at both sites in the wet and dry season. Labels for the x-axis: M wet-wet season microscopy, M dry-dry season microscopy, S-M wet-wet season submicroscopic, and S-M dry-dry season submicroscopic.